Exam 14: Aggregate Expenditure Multiplier
Exam 1: Getting Started350 Questions
Exam 2: The Usand Global Economies199 Questions
Exam 3: The Economic Problem271 Questions
Exam 4: Demand and Supply317 Questions
Exam 5: Gdp: a Measure of Total Production and Income254 Questions
Exam 6: Jobs and Unemployment343 Questions
Exam 7: The Cpi and the Cost of Living265 Questions
Exam 8: Potential Gdp and the Natural Unemployment Rate207 Questions
Exam 9: Economic Growth267 Questions
Exam 10: Finance, Saving, and Investment269 Questions
Exam 11: The Monetary System361 Questions
Exam 12: Money, Interest, and Inflation261 Questions
Exam 13: Aggregate Supply and Aggregate Demand272 Questions
Exam 14: Aggregate Expenditure Multiplier311 Questions
Exam 15: The Short-Run Policy Tradeoff208 Questions
Exam 16: Fiscal Policy203 Questions
Exam 17: Monetary Policy188 Questions
Exam 18: International Trade Policy218 Questions
Exam 19: International Finance255 Questions
Select questions type
An insight into business cycles is gained by the fact that
Free
(Multiple Choice)
4.7/5  (38)
(38)
Correct Answer: Verified
C
In an economy with no income taxes or imports, the marginal propensity to consume is 0.80.The expenditure multiplier is
Free
(Multiple Choice)
4.9/5 (36)
Correct Answer:Verified
D
The level of equilibrium expenditure at each price level determines
Free
(Multiple Choice)
4.9/5 (31)
Correct Answer:Verified
A
Real GDP (billions of 2005 dollars) Aggregate expenditure (billions of 2005 dollars) 10 10.50 11 11.25 12 12.00 13 12.75 14 13.50 15 14.25
-The above table gives real GDP and the aggregate expenditure schedule.When real GDP is $10 billion, the amount of unplanned investment is
(Multiple Choice)
4.8/5 (30)
Real GDP, Y (billions of 2005 dollars) Consumption expenditure, C Investment, I Government expenditure, G (billions of 2005 dollars) (billions of 2005 dollars) (billions of 2005 dollars) 100 150 150 100 200 200 150 100 300 250 150 100 400 300 150 100 500 350 150 100 600 400 150 100 700 450 150 100 800 500 150 100 900 550 150 100
-The above table gives data for the nation of South Hampton.There are no imports into or exports from South Hampton.If real GDP is equal to $900 billion, then
(Multiple Choice)
5.0/5 (39)
Disposable income (trillions of 2005 dollars) Consumption expenditure (trillions of 2005 dollars) 0.0 1.8 1.0 2.6 2.0 3.2 3.0 4.0 4.0 5.8
-The above table has data from the nation of Atlantica.Based on these data, when disposal income equals $3.0 trillion,
(Multiple Choice)
4.7/5 (38)
Which of the following is not a part of aggregate expenditure?
(Multiple Choice)
4.8/5 (43)
In order to analyze the factors that determine the quantity of real GDP demanded, in the aggregate expenditure model we assume that
(Multiple Choice)
4.8/5 (32)
Consumption Real GDP, Y (trillions of Government (trillions of Investment, I (trillions of expenditure, G (trillions of Exports, X (trillions of Imports, M (trillions of 2005 dollars) 2005 dollars) 2005 dollars) 2005 dollars) 2005 dollars) 2005 dollars) 0 1.00 2 1 1 0.50 1 1.75 2 1 1 0.75 2 2.50 2 1 1 1.00 3 3.25 2 1 1 1.25 4 4.00 2 1 1 1.50 5 4.75 2 1 1 1.75 6 5.50 2 1 1 2.00 7 6.25 2 1 1 2.25 8 7.00 2 1 1 2.50 9 7.75 2 1 1 2.75 10 8.50 2 1 1 3.00
-The table above gives data for the nation of Mosh.If real GDP is $6 trillion, then
(Multiple Choice)
4.7/5 (34)
A movement along the consumption function shows the change in consumption expenditure as a result of a change in
(Multiple Choice)
4.7/5 (29)
If autonomous imports increase, then the aggregate expenditure curve shifts ________ and equilibrium real GDP ________.
(Multiple Choice)
4.9/5 (37)
Which of the following increases as a result of an increase in real GDP?
i. autonomous expenditure
ii. induced expenditure
iii. potential GDP
(Multiple Choice)
4.9/5 (36)
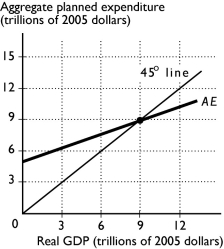 -In the figure above, if real GDP is $12 trillion, aggregate planned expenditure is ________ $12 trillion and unplanned inventory changes are ________.
(Multiple Choice)
4.9/5 (32)
As disposable income ________ planned consumption expenditure ________ by a ________ amount.
(Multiple Choice)
4.7/5 (38)
When GDP = $2.5 trillion, C = $1.0 trillion, I = $0.6 trillion, G = $0.4 trillion, and NX = $0.Then
(Multiple Choice)
4.9/5 (32)
The consumption function shows that when disposable income increases by one dollar, consumption expenditure
(Multiple Choice)
4.9/5 (30)
Real GDP, Y (billions of 2005 dollars) Consumption expenditure, C (billions of 2005 Investment, I Government expendithare, G (billions of 2005 (billions of 2005 dollars) dollars) 100 150 150 150 200 200 150 150 300 250 150 150 400 300 150 150 500 350 150 150 600 400 150 150 700 450 150 150 800 500 150 150 900 550 150 150
-The above table gives data for the nation of Mouseville.There are no imports into or exports from Mouseville.The equilibrium level of real GDP is
(Multiple Choice)
4.9/5 (36)
Filters
- Essay(0)
- Multiple Choice(0)
- Short Answer(0)
- True False(0)
- Matching(0)