Exam 8: Potential Gdp and the Natural Unemployment Rate
Discuss how an efficiency wage leads to an increase in the natural unemployment rate.Draw a demand and supply diagram for the labor market and relate your discussion to the figure.
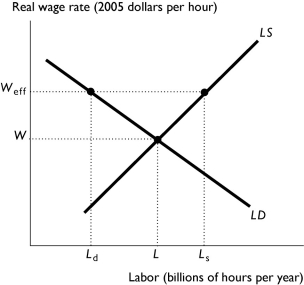 An efficiency wage rate is a wage that is set by a firm above the equilibrium wage rate in order to motivate the firm's workers to work hard.The idea is that workers will work hard in order to keep their jobs because they know that if they are fired, the (equilibrium) wage rate they are likely to get at a new job will be less than the efficiency wage.But, because the efficiency wage rate exceeds the equilibrium wage rate, there is a surplus of labor because the quantity of labor demanded decreases and the quantity supplied increases.The surplus is unemployment.In the figure above, the equilibrium real wage rate is W and the efficiency wage is Wₑff.At the equilibrium wage rate, there is no unemployment because the quantity of labor demanded equals the quantity supplied.But, with the efficiency wage, the figure shows that there is a surplus of labor.This surplus, which is the amount of unemployment, equals the quantity of labor supplied, Ls, minus the quantity of labor demanded, Ld.
The benefit to the firm of hiring another worker is
D
Quantity of labor demanded Real wage rate (billions of hours (2005 dollars) Quantity of labor supplied (billions of hours per year) 50 80 100 40 90 90 30 100 80 20 110 70 10 120 60
Employment (billions Real GDP of hours (billions of per year) 2005 dollars) 60 2.0 70 3.0 80 3.7 90 4.2 110 4.5
-The tables above show a nation's labor demand and labor supply schedules and its production function.The equilibrium real wage rate is ________ and the equilibrium quantity of labor is ________ billion hours per year.
B
The Fair Labor Standards Act originally set the minimum wage at
An increase in the wage rate ________ the quantity of labor supplied and ________ the quantity of labor demanded.
The idea that potential GDP is the sustainable upper limit of production means that
The length of time an unemployed person searches for a job is likely to increase as
The Bubby Gum factory produces bubble gum.Joanne is one of the employees, and she produces 10 packs of bubble gum per hour.Joanne's money wage rate is $12 per hour.If a packet of bubble gum sells for $1.00, then
8.3 Chapter Figures
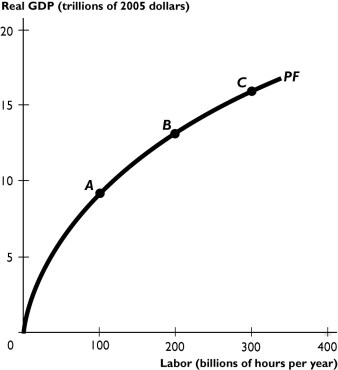 -The figure above shows the U.S.production function.How would an increase in unemployment benefits be shown in the figure?
 -If the government increases unemployment benefits, then the equilibrium amount of employment ________ and potential GDP ________.
What is job search and what is the relationship between job search and unemployment?
What factors can affect the amount of job search?
Briefly discuss the effect of each factor.
Real wage rate Labor demand (billions of (2005 dollars) habor supply (billions of 5 360 260 10 325 275 15 300 300 20 280 330
Employment (billions of hours per year) Real GDP (trillions of 2005 dollars) 100 2.0 200 3.0 300 3.8 400 4.4
-The first table above gives the labor demand and labor supply schedules for a nation.The second table gives its production function.
a. What is the equilibrium real wage rate and the level of employment?
b. What is potential GDP?
If you cannot determine a precise amount, give the range in which potential GDP must lie.
Holding all other influences constant, the quantity of labor supplied in a given time period depends
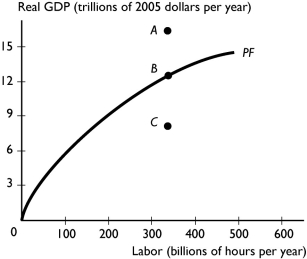 -The above figure shows a nation's production function.Point B is
Filters
- Essay(0)
- Multiple Choice(0)
- Short Answer(0)
- True False(0)
- Matching(0)