Exam 14: Aggregate Expenditure Multiplier
Exam 1: Getting Started350 Questions
Exam 2: The Usand Global Economies199 Questions
Exam 3: The Economic Problem271 Questions
Exam 4: Demand and Supply317 Questions
Exam 5: Gdp: a Measure of Total Production and Income254 Questions
Exam 6: Jobs and Unemployment343 Questions
Exam 7: The Cpi and the Cost of Living265 Questions
Exam 8: Potential Gdp and the Natural Unemployment Rate207 Questions
Exam 9: Economic Growth267 Questions
Exam 10: Finance, Saving, and Investment269 Questions
Exam 11: The Monetary System361 Questions
Exam 12: Money, Interest, and Inflation261 Questions
Exam 13: Aggregate Supply and Aggregate Demand272 Questions
Exam 14: Aggregate Expenditure Multiplier311 Questions
Exam 15: The Short-Run Policy Tradeoff208 Questions
Exam 16: Fiscal Policy203 Questions
Exam 17: Monetary Policy188 Questions
Exam 18: International Trade Policy218 Questions
Exam 19: International Finance255 Questions
Select questions type
Real GDP, Y (billions of 2005 dollars) Consumption expenditure, C (billions of 2005 Investment, I Government expendithare, G (billions of 2005 (billions of 2005 dollars) dollars) 100 150 150 150 200 200 150 150 300 250 150 150 400 300 150 150 500 350 150 150 600 400 150 150 700 450 150 150 800 500 150 150 900 550 150 150
-The above table gives information for the nation of North Hampton.There are no imports to or exports from North Hampton.
a. Find aggregate planned expenditure for each level of real GDP.
b. What is the equilibrium level of real GDP?
(Essay)
4.8/5  (38)
(38)
Disposable income (trillions of 2005 dollars) Consumption expenditure (trillions of 2005 dollars) 0.0 1.5 2.0 3.0 4.0 4.5 6.0 6.0 8.0 7.5
-The above table has data from the nation of Atlantica.Based on these data, at what point does saving equal zero.
(Multiple Choice)
4.9/5 (32)
Real GDP is $5 trillion and aggregate planned expenditure is $7 trillion.As a result, unplanned inventory change is ________ and real GDP ________.
(Multiple Choice)
4.7/5 (39)
As the economy turns the corner into a recession, the level of unplanned inventories ________ and firms ________ production.
(Multiple Choice)
4.8/5 (42)
What is the key difference between the aggregate expenditure model and the aggregate demand/aggregate supply model?
(Multiple Choice)
4.8/5 (42)
Which of the following increases the size of the expenditure multiplier?
(Multiple Choice)
4.9/5 (46)
Briefly describe how imports and taxes affect the size of the expenditure multiplier.
(Essay)
5.0/5 (42)
The aggregate expenditure model predicts a business cycle expansion occurs when
(Multiple Choice)
4.8/5 (40)
Disposable income (trillions of 2005 dollars) Consumption expenditure (trillions of 2005 dollars) 0.0 1.5 2.0 3.0 4.0 4.5 6.0 6.0 8.0 7.5
-The above table has data from the nation of Atlantica.Based on these data, the amount of autonomous consumption is
(Multiple Choice)
4.8/5 (41)
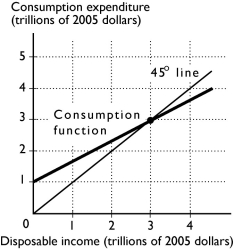 -The figure above shows a nation's consumption function.If disposable income is $4 trillion, then the MPC is ________ and saving is ________.
(Multiple Choice)
4.8/5 (44)
The ________ the marginal propensity to import, the ________ the expenditure multiplier.
(Multiple Choice)
5.0/5 (35)
Disposable income (trillions of 2005 dollars) Consumption expenditure (trillions of 2005 dollars) 0.0 1.5 2.0 3.0 4.0 4.5 6.0 6.0 8.0 7.5
-The above table has data from the nation of Media.Based on these data, when disposable income is $8.0 trillion, saving is
(Multiple Choice)
4.9/5 (43)
Based on data from the U.S.economy, the marginal propensity to consume is about
(Multiple Choice)
4.8/5 (28)
When the price level increases, aggregate planned expenditure ________ and equilibrium real GDP ________. As a result, in the AS-AD model, the aggregate demand curve has a ________ slope.
(Multiple Choice)
4.9/5 (42)
If aggregate planned expenditure is greater than real GDP,
(Multiple Choice)
4.9/5 (38)
If the economy is in the expansion phase of a business cycle and investment increases, when the multiplier effect kicks in the expansion
(Multiple Choice)
4.9/5 (37)
When the price level falls, the aggregate planned expenditure curve shifts ________, equilibrium expenditure ________ and there is a movement ________ along the aggregate demand curve.
(Multiple Choice)
4.8/5 (34)
"A country's expenditure multiplier is constant over time." Explain whether the previous statement is correct or incorrect.
(Essay)
4.9/5 (38)
Filters
- Essay(0)
- Multiple Choice(0)
- Short Answer(0)
- True False(0)
- Matching(0)