Exam 20: Understanding Graphs
Exam 1: The Art and Science of Economic Analysis108 Questions
Exam 2: Economic Tools and Economic Systems152 Questions
Exam 3: Economic Decision Makers145 Questions
Exam 4: Demand, Supply, and Markets203 Questions
Exam 5: Algebraic Approach to Demand, Supply, and Equilibrium12 Questions
Exam 6: Introduction to Macroeconomics122 Questions
Exam 7: Tracking the Canadian Economy147 Questions
Exam 8: Unemployment and Inflation134 Questions
Exam 9: Productivity and Growth68 Questions
Exam 10: Aggregate Expenditure and Aggregate Demand147 Questions
Exam 11: Aggregate Supply156 Questions
Exam 12: Fiscal Policy167 Questions
Exam 13: Money and the Financial System95 Questions
Exam 14: Banking and the Money Supply144 Questions
Exam 15: Monetary Theory and Policy in an Open Economy130 Questions
Exam 16: Macro Policy Debate: Active or Passive130 Questions
Exam 17: International Finance163 Questions
Exam 18: International Trade112 Questions
Exam 19: Economic Development57 Questions
Exam 20: Understanding Graphs52 Questions
Select questions type
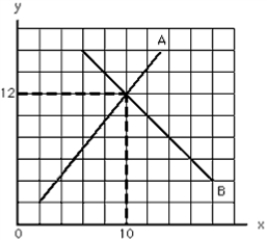
Exhibit 1A-14
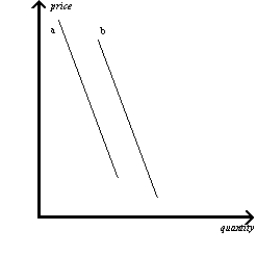 -Refer to the exhibit.Why would line a shift to the position of line b?
(Multiple Choice)
4.8/5  (35)
(35)
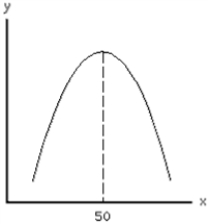
Exhibit 1A-4
a.
 b.
b.
 c.
c.
 d.
d.
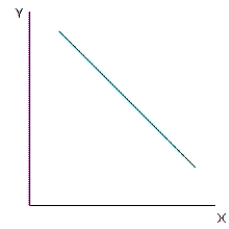
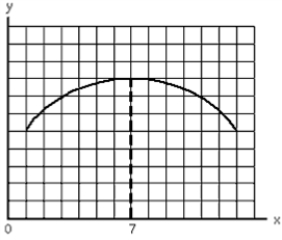
 -Refer to the exhibit.Which statement describes Curve A?
(Multiple Choice)
4.8/5 (35)
On a graph with x on the horizontal axis and y on the vertical axis, what is the origin?
(Multiple Choice)
4.7/5 (36)
Exhibit 1A-1
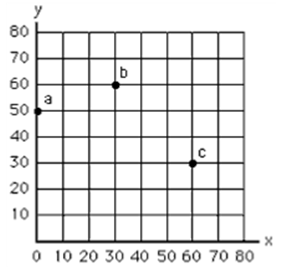 -Refer to the exhibit.What does point c represent?
(Multiple Choice)
4.9/5 (37)
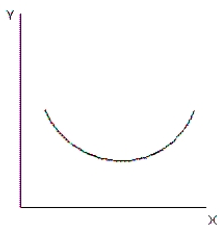
Exhibit 1A-13
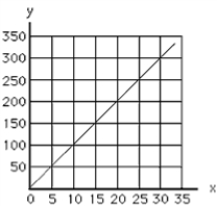
 -Refer to exhibit.What is the slope of the curve where x equals 50?
(Multiple Choice)
4.9/5 (51)
Exhibit 1A-2
 -Refer to the exhibit.At x = 8, what is the value of y?
(Multiple Choice)
4.8/5 (34)
A graph shows Ron's weight on the vertical axis and his consumption of ice cream on the horizontal axis.Suppose the graph indicates that for each serving of ice cream he eats, Ron gains 2 kilograms, regardless of how much ice cream he had already eaten.What would this graph show?
(Multiple Choice)
4.9/5 (42)
Exhibit 1A-4
a.
b.
c.
d.
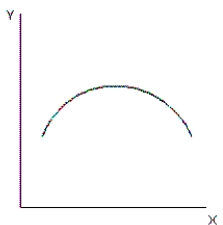
-Refer to the exhibit.Which graph illustrates a relationship between variable X and variable Y that begins positively but then changes to a negative relationship?
(Multiple Choice)
4.8/5 (33)
How many economic variables are involved in the relationship reflected on most economics graphs?
(Multiple Choice)
4.9/5 (39)
Exhibit 1A-4
a.
b.
c.
d.
-Refer to the exhibit.What is the slope of the curve equal to?
(Multiple Choice)
4.9/5 (40)
Exhibit 1A-4
a.
b.
c.
d.
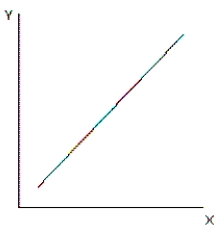
-Refer to the exhibit.Which graph illustrates a direct or positive relationship between variable X and variable Y?
(Multiple Choice)
4.9/5 (33)
Which of the following would cause a line on a graph to shift?
(Multiple Choice)
4.8/5 (38)
Exhibit 1A-9
 -Refer to the exhibit.Which statement best describes the slope of the line?
(Multiple Choice)
4.9/5 (37)
Which of the following is the best definition of a slope of a line?
(Multiple Choice)
4.8/5 (37)
What can be assumed if a given value of x is associated with a particular value of y?
(Multiple Choice)
4.7/5 (38)
Exhibit 1A-7
 -Refer to the exhibit.What is the slope of the line?
(Multiple Choice)
4.8/5 (38)
Ron weighs 70 kilograms.A graph relates Ron's weight on the vertical axis to Nancy's consumption of ice cream on the horizontal axis.Which statement describes the line on the graph?
(Multiple Choice)
4.8/5 (30)
Suppose y is measured on the vertical axis, x is measured on the horizontal axis, and the various combinations of x and y are shown by a non-vertical straight line.Which of the following describes the relationship between x and y?
(Multiple Choice)
4.9/5 (30)
Filters
- Essay(0)
- Multiple Choice(0)
- Short Answer(0)
- True False(0)
- Matching(0)