Exam 20: Understanding Graphs
Exam 1: The Art and Science of Economic Analysis108 Questions
Exam 2: Economic Tools and Economic Systems152 Questions
Exam 3: Economic Decision Makers145 Questions
Exam 4: Demand, Supply, and Markets203 Questions
Exam 5: Algebraic Approach to Demand, Supply, and Equilibrium12 Questions
Exam 6: Introduction to Macroeconomics122 Questions
Exam 7: Tracking the Canadian Economy147 Questions
Exam 8: Unemployment and Inflation134 Questions
Exam 9: Productivity and Growth68 Questions
Exam 10: Aggregate Expenditure and Aggregate Demand147 Questions
Exam 11: Aggregate Supply156 Questions
Exam 12: Fiscal Policy167 Questions
Exam 13: Money and the Financial System95 Questions
Exam 14: Banking and the Money Supply144 Questions
Exam 15: Monetary Theory and Policy in an Open Economy130 Questions
Exam 16: Macro Policy Debate: Active or Passive130 Questions
Exam 17: International Finance163 Questions
Exam 18: International Trade112 Questions
Exam 19: Economic Development57 Questions
Exam 20: Understanding Graphs52 Questions
Select questions type
Which of the following is an economic application of the slope of a line?
Free
(Multiple Choice)
4.7/5  (31)
(31)
Correct Answer: Verified
C
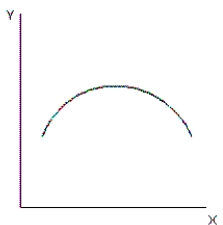
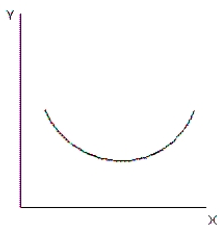
Exhibit 1A-12
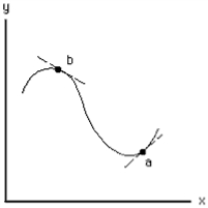 -Exhibit 1A-12.Compare the slopes of the tangents at points a and b. Which statement best describes the slope of a and b?
Free
(Multiple Choice)
4.8/5 (37)
Correct Answer:Verified
A
Exhibit 1A-8
0 50 100 250 200 450 300 650 400 850
-Refer to the exhibit.What would the slope of a line graphed with x on the horizontal axis and y on the vertical axis be equal to?
Free
(Multiple Choice)
4.7/5 (28)
Correct Answer:Verified
C
Exhibit 1A-3
 -Refer to the exhibit.For any value of x, what is the value of y?
(Multiple Choice)
4.9/5 (30)
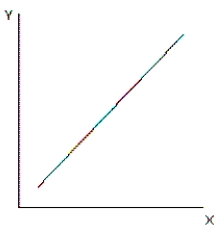
Exhibit 1A-6
 -Refer to the exhibit.Which statement best describes the slope of the straight line?
(Multiple Choice)
4.8/5 (46)
Slope = 2 for a line on a graph with x on the horizontal axis and y on the vertical axis.If x decreases by 4, what happens to y?
(Multiple Choice)
4.8/5 (38)
Which of the following best describes the slope of a vertical line?
(Multiple Choice)
4.7/5 (38)
What part of a graph is most applicable to marginal analysis?
(Multiple Choice)
4.9/5 (38)
Exhibit 1A-2
 -Refer to the exhibit.At x = 10, what is the value of y?
(Multiple Choice)
4.9/5 (26)
Exhibit 1A-5
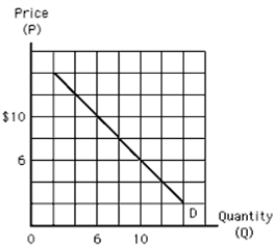 -Refer to the exhibit.According to the curve, if P = $8 then what is Q equal to?
(Multiple Choice)
4.8/5 (29)
Slope = -2 for a line on a graph with x on the horizontal axis and y on the vertical axis.If x increases by 4, what happens to y?
(Multiple Choice)
4.8/5 (33)
The cost of producing copper tubing is $1 per metre.Production costs are measured on the vertical axis and quantity of copper tubing is measured on the horizontal axis.Which of the following would have the smallest slope?
(Multiple Choice)
4.9/5 (34)
Exhibit 1A-4
a.
 b.
b.
 c.
c.
 d.
d.
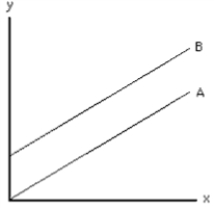
 -Refer to the exhibit.Which statement describes Curve B?
(Multiple Choice)
4.9/5 (27)
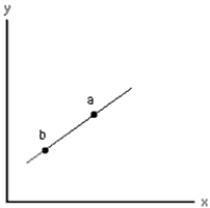
Exhibit 1A-1
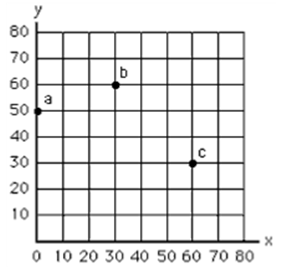 -Refer to the exhibit.What does point a represent?
(Multiple Choice)
4.7/5 (36)
Exhibit 1A-2
-Refer to the exhibit.At y = 10, what is the value of x?
(Multiple Choice)
4.9/5 (32)
Exhibit 1A-4
a.
b.
c.
d.
-Refer to the exhibit.Which graph illustrates a relationship between variable X and variable that begins negatively, but changes to a positive relationship?
(Multiple Choice)
4.8/5 (39)
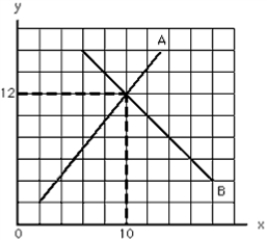
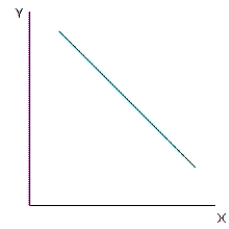
Exhibit 1A-10
 -Refer to the exhibit.Which statement best describes the slope of the line?
(Multiple Choice)
4.9/5 (37)
Filters
- Essay(0)
- Multiple Choice(0)
- Short Answer(0)
- True False(0)
- Matching(0)