Exam 3: Demand and Supply
Exam 1: The Nature of Economics346 Questions
Exam 2: Scarcity and the World of Trade-Offs410 Questions
Exam 3: Demand and Supply448 Questions
Exam 4: Extensions of Demand and Supply Analysis398 Questions
Exam 5: Public Spending and Public Choice359 Questions
Exam 6: Funding the Public Sector201 Questions
Exam 7: The Macroeconomy: Unemployment, Inflation, and Deflation412 Questions
Exam 8: Global Economic Growth and Development282 Questions
Exam 9: Real GDP and the Price Level in the Long Run291 Questions
Exam 10: Classical and Keynesian Macro Analyses365 Questions
Exam 11: Consumption, Real GDP, and the Multiplier445 Questions
Exam 12: Fiscal Policy273 Questions
Exam 13: Deficit Spending and the Public Debt145 Questions
Exam 14: Money Banking and Central Banking516 Questions
Exam 15: Domestic and International Dimensions of Monetary Policy356 Questions
Exam 16: Stabilization in an Integrated World Economy305 Questions
Exam 17: Policies and Prospects for Global Economic Growth216 Questions
Exam 18: Comparative Advantage and the Open Economy314 Questions
Exam 19: Exchange Rates and the Balance of Payments300 Questions
Select questions type
A change in the ceteris paribus conditions for supply will lead to a
(Multiple Choice)
4.8/5  (39)
(39)
What is the difference between a normal good and an inferior good?
How does this relate to the demand curve?
(Essay)
5.0/5 (36)
What information is provided by a demand curve?
What variables are measured along the axes of the graph?
(Essay)
4.9/5 (48)
The only variable that can affect a movement along the demand curve is
(Multiple Choice)
4.9/5 (35)
Which of the following is a non-price determinant of supply?
(Multiple Choice)
4.9/5 (39)
"A shortage is the same thing as scarcity." Do you agree or disagree with this statement?
Why?
What can cause a shortage to disappear in a market?
What can cause scarcity to disappear?
(Essay)
4.7/5 (41)
Suppose it is discovered that consumption of butter leads to a longer life. This information would lead to
(Multiple Choice)
4.8/5 (33)
The arrangements that individuals have with each other to exchange goods is known as
(Multiple Choice)
4.9/5 (42)
A schedule of how much of a good people will purchase for a range of possible prices during a specified time period, other things constant, is the definition of
(Multiple Choice)
4.8/5 (44)
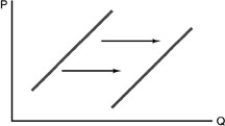 -Refer to the above figure. The rightward shift of the curve could have been caused by
(Multiple Choice)
4.7/5 (30)
Filters
- Essay(0)
- Multiple Choice(0)
- Short Answer(0)
- True False(0)
- Matching(0)