Exam 3: Demand and Supply
Exam 1: The Nature of Economics346 Questions
Exam 2: Scarcity and the World of Trade-Offs410 Questions
Exam 3: Demand and Supply448 Questions
Exam 4: Extensions of Demand and Supply Analysis398 Questions
Exam 5: Public Spending and Public Choice359 Questions
Exam 6: Funding the Public Sector201 Questions
Exam 7: The Macroeconomy: Unemployment, Inflation, and Deflation412 Questions
Exam 8: Global Economic Growth and Development282 Questions
Exam 9: Real GDP and the Price Level in the Long Run291 Questions
Exam 10: Classical and Keynesian Macro Analyses365 Questions
Exam 11: Consumption, Real GDP, and the Multiplier445 Questions
Exam 12: Fiscal Policy273 Questions
Exam 13: Deficit Spending and the Public Debt145 Questions
Exam 14: Money Banking and Central Banking516 Questions
Exam 15: Domestic and International Dimensions of Monetary Policy356 Questions
Exam 16: Stabilization in an Integrated World Economy305 Questions
Exam 17: Policies and Prospects for Global Economic Growth216 Questions
Exam 18: Comparative Advantage and the Open Economy314 Questions
Exam 19: Exchange Rates and the Balance of Payments300 Questions
Select questions type
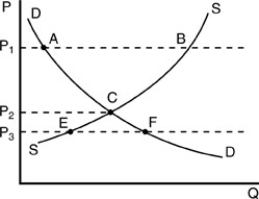 -Using the above figure, at which price is there neither excess quantity demanded nor excess quantity supplied?
(Multiple Choice)
5.0/5  (34)
(34)
Which of the following causes a decrease in demand for a normal good?
(Multiple Choice)
4.9/5 (39)
The demand curve shows the relationship between quantity demanded and
(Multiple Choice)
4.8/5 (40)
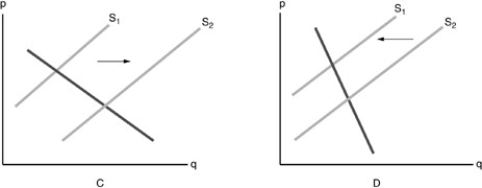 -Refer to the above figure. Corn is an input for producing Corn Flakes. Which diagram shows the effect on the supply of Corn Flakes when the price of corn has increased?
(Multiple Choice)
4.8/5 (40)
An expected increase in the future price of automobiles will lead to
(Multiple Choice)
4.8/5 (45)
Which of the following will occur as the price of a good decreases?
(Multiple Choice)
4.7/5 (42)
If goods X and Y are substitute goods, then an increase in the price of Y, other things being equal,
(Multiple Choice)
4.8/5 (46)
A significant increase in the price of tennis balls will most likely lead to
(Multiple Choice)
4.9/5 (33)
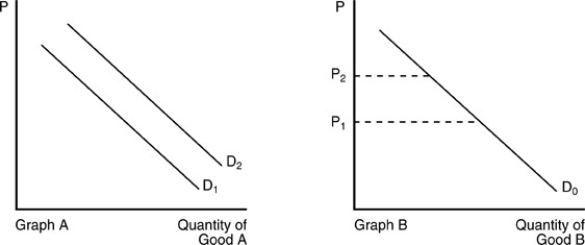 -In the above figure, the demand curve for Good A shifts from D₁ to D₂ in Graph A when the price of Good B changes from P₁ to P₂ in Graph B. We can conclude that
(Multiple Choice)
5.0/5 (39)
Distinguish between a change in demand and a change in quantity demanded.
(Essay)
4.9/5 (38)
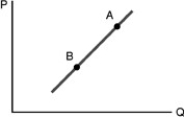 -Refer to the above figure. Moving from point A to point B indicates
(Multiple Choice)
4.9/5 (36)
Which of the following statements is FALSE about the demand curve?
(Multiple Choice)
4.7/5 (42)
Filters
- Essay(0)
- Multiple Choice(0)
- Short Answer(0)
- True False(0)
- Matching(0)