Exam 3: Demand and Supply
Exam 1: What Is Economics479 Questions
Exam 2: The Economic Problem439 Questions
Exam 3: Demand and Supply515 Questions
Exam 4: Measuring GDP and Economic Growth396 Questions
Exam 5: Monitoring Jobs and Inflation407 Questions
Exam 6: Economic Growth353 Questions
Exam 7: Finance, Saving, and Investment240 Questions
Exam 8: Money, The Price Level, and Inflation583 Questions
Exam 9: The Exchange Rate and the Balance of Payments481 Questions
Exam 10: Aggregate Supply and Aggregate Demand418 Questions
Exam 11: Expenditure Multipliers454 Questions
Exam 12: Inflation, Jobs, and the Business Cycle401 Questions
Exam 13: Fiscal Policy263 Questions
Exam 14: Monetary Policy225 Questions
Exam 15: International Trade Policy197 Questions
Exam 16: Introduction23 Questions
Exam 17: Monitoring Macroeconomic Performance11 Questions
Exam 18: Macroeconomic Trends19 Questions
Exam 19: Macroeconomic Fluctuations23 Questions
Exam 20: Macroeconomic Policy25 Questions
Select questions type
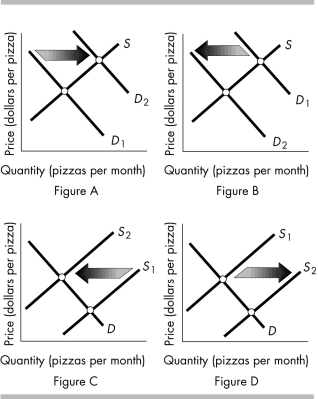 -The above figure shows the market for pizza.Which figure shows the effect of a new report by the U.S.Surgeon General that eating pizza lowers cholesterol levels,an outcome many people want?
(Multiple Choice)
4.9/5  (42)
(42)
What is the effect on the price and quantity of a product if both the demand and supply simultaneously increase?
(Essay)
4.7/5 (36)
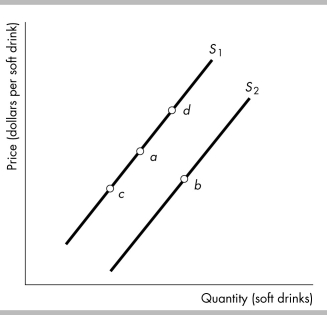 -The figure above shows supply curves for soft drinks.Suppose the economy is at point a.A movement to point d would be the result of
(Multiple Choice)
4.9/5 (38)
If good A is a normal good and income increases,the equilibrium price of A ________ and the equilibrium quantity of A ________.
(Multiple Choice)
4.8/5 (36)
The quantity of iPods that people plan to buy this month depends on all of the following EXCEPT the
(Multiple Choice)
4.9/5 (34)
You observe that the price of a good rises and the quantity decreases.These observations can be the result of the
(Multiple Choice)
4.9/5 (44)
Suppose that people find out that eating more fish improves their health,leading them to increase their demand for fish.As a result,the equilibrium price of fish ________ and the equilibrium quantity ________.
(Multiple Choice)
4.7/5 (35)
If the quantity of textbooks supplied is 10,000 per year and the quantity of textbooks demanded is 12,000 per year,there is a ________ in the market and the price will ________.
(Multiple Choice)
4.8/5 (40)
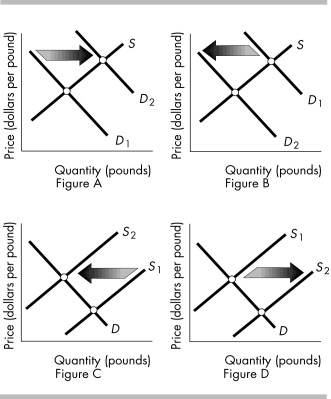
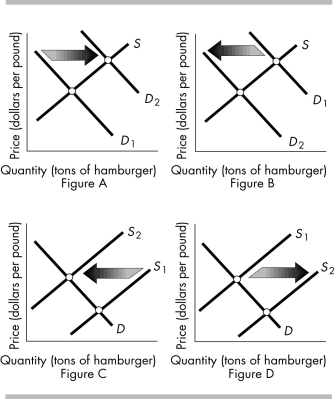 -The above figures show the market for hamburger meat.Which figure(s) shows the effect of an increase in the price of a hamburger bun,a complement for hamburger meat?
(Multiple Choice)
4.9/5 (47)
Which of the following pairs of goods are most likely substitutes?
(Multiple Choice)
4.8/5 (35)
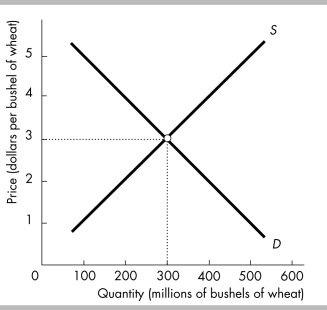 -In the figure,the equilibrium price is initially $3 per bushel of wheat.If suppliers come to expect that the price of a bushel of wheat will rise in the future,but buyers do not,the current equilibrium price will
(Multiple Choice)
4.9/5 (34)
 -The above figures show the market for oranges.Which figure(s) shows the effect of a nation-wide consumer boycott of eating oranges?
(Multiple Choice)
4.9/5 (39)
If the price of a candy bar is $1 and the price of a fast food meal is $5,then the
(Multiple Choice)
4.8/5 (39)
Pizza and hamburgers are substitutes for consumers.A fall in the price of a pizza ________ the price of a hamburger and ________ the quantity of hamburgers.
(Multiple Choice)
4.7/5 (33)
Young drivers often buy used cars.An increase in the legal driving age to twenty-one shifts the demand curve for used cars leftward,whereas lowering the age to fifteen shifts the demand curve rightward.
(True/False)
4.9/5 (35)
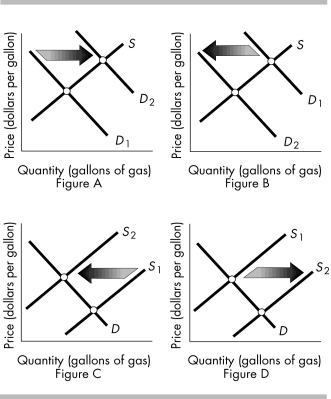 -The above figures show the market for gasoline.Which figure shows the effect of the end of a nine month strike by workers at all U.S.oil refineries?
(Multiple Choice)
5.0/5 (41)
Filters
- Essay(0)
- Multiple Choice(0)
- Short Answer(0)
- True False(0)
- Matching(0)