Exam 3: Descriptive Statistics
Exam 1: Introduction to Statistics60 Questions
Exam 2: Organizing and Visualizing Data95 Questions
Exam 3: Descriptive Statistics53 Questions
Exam 4: Gathering Data44 Questions
Exam 5: Probability83 Questions
Exam 6: Decision Analysis and Expected Value42 Questions
Exam 7: Discrete Probability Distributions85 Questions
Exam 8: Continuous Distributions64 Questions
Exam 9: Sampling Distributions65 Questions
Exam 10: Confidence Intervals82 Questions
Exam 11: Hypothesis Testing for Single Populations77 Questions
Exam 12: Hypothesis Testing for Two Populations72 Questions
Exam 13: Analysis of Variance Anova45 Questions
Exam 14: Linear Correlation and Simple Linear Regression Analysis110 Questions
Exam 15: Categorical Versus Categorical: Tests78 Questions
Select questions type
The following frequency distribution was constructed for the age of accounts receivable: 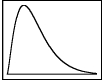 The frequency distribution reveals that the accounts receivable ages are ___.
(Multiple Choice)
4.7/5  (38)
(38)
Skewness indicates that a data distribution is symmetrical or asymmetrical.
(True/False)
4.8/5 (28)
Consider the following data: 0, 2, 4, 6, 11, 12, 13. The 35th percentile is
(Multiple Choice)
4.9/5 (30)
An instructor is evaluating the performance of students on a test. He records the number of points that each student missed and created a frequency distribution. This is provided below: 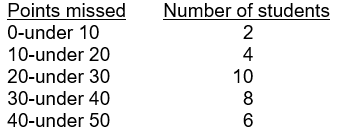 What is the variance for this population?
(Multiple Choice)
4.8/5 (38)
Kurtosis is a measure of the association between two numerical variables.
(True/False)
4.8/5 (32)
___ are quantiles that divide a group of data into 100 parts.
(Multiple Choice)
4.9/5 (31)
Excel can produce individual or multiple descriptive statistics.
(True/False)
4.9/5 (32)
If the mean of a distribution is greater than the median, then the distribution is positively skewed.
(True/False)
4.8/5 (40)
Shaun Connor, Human Resources Manager for Oil Terminals (OT), is reviewing the operator training hours at OT nationally. His staff compiled the following table of national statistics on operators training hours.  What can Shaun conclude from these statistics?
(Multiple Choice)
4.8/5 (33)
The range and interquartile range don't take into account all of the values in a data set when describing variation.
(True/False)
4.8/5 (34)
The middle value in an ordered array of numbers is called the mode.
(True/False)
4.8/5 (39)
The following frequency distribution was constructed for the age of accounts receivable: 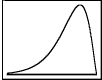 The frequency distribution reveals that the accounts receivable ages are ___.
(Multiple Choice)
4.7/5 (32)
Filters
- Essay(0)
- Multiple Choice(0)
- Short Answer(0)
- True False(0)
- Matching(0)