Exam 12: Antitrust and Regulation
Exam 1: Economics: The World Around You90 Questions
Exam 2: Choice, opportunity Costs, and Specialization95 Questions
Exam 3: Markets, Demand and Supply, and the Price System98 Questions
Exam 4: The Market System and the Private and Public Sector100 Questions
Exam 5: Elasticity: Demand and Supply132 Questions
Exam 6: Consumer Choice142 Questions
Exam 7: Supply: The Costs of Doing Business106 Questions
Exam 8: Profit Maximization122 Questions
Exam 9: Perfect Competition135 Questions
Exam 10: Monopoly118 Questions
Exam 11: Monopolistic Competition and Oligopoly114 Questions
Exam 12: Antitrust and Regulation100 Questions
Exam 13: Market Failures, Government Failures, and Rent Seeking121 Questions
Exam 14: Resource Markets112 Questions
Exam 15: The Labor Market117 Questions
Exam 16: Capital Markets100 Questions
Exam 17: The Land Market and Natural Resources55 Questions
Exam 18: Aging, Social Security and Health Care88 Questions
Exam 19: Income Distribution,Poverty and Government Policy115 Questions
Exam 20: World Trade Equilibrium112 Questions
Exam 21: International Trade Restrictions109 Questions
Exam 22: Exchange Rates and Financial Links Between Countries132 Questions
Select questions type
In the following figure,the first panel shows a market situation prior to regulation and the second panel shows the effects of regulation. Figure 12.2  In the figure,
D: Demand curve for automobiles
S1: Supply curve of automobiles prior to regulation
S2: Supply curve of automobiles after regulation
FG: Clean up cost per unit
-According to Figure 12.2,the total clean up cost after the regulation is:
In the figure,
D: Demand curve for automobiles
S1: Supply curve of automobiles prior to regulation
S2: Supply curve of automobiles after regulation
FG: Clean up cost per unit
-According to Figure 12.2,the total clean up cost after the regulation is:
(Multiple Choice)
4.8/5  (29)
(29)
Bills introduced in the United States in 2009 reduced overall trade between America and the rest of the world.
(True/False)
4.9/5 (30)
If the Herfindahl index for automobiles take foreign competition into account,the Herfindahl index for the U.S.automobile industry would be significantly higher.
(True/False)
4.8/5 (27)
Which of the following does the Sherman Antitrust Act forbid?
(Multiple Choice)
4.8/5 (50)
In the following figure,the first panel shows a market situation prior to regulation and the second panel shows the effects of regulation. Figure 12.2 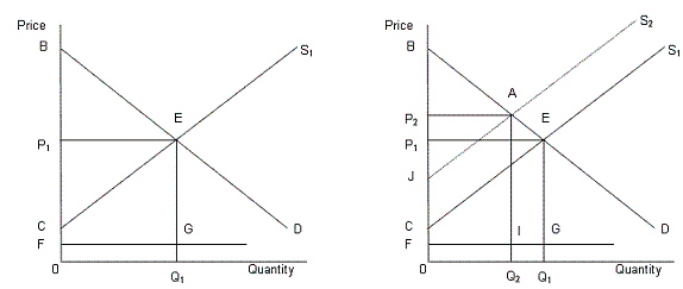 In the figure,
D: Demand curve for automobiles
S1: Supply curve of automobiles prior to regulation
S2: Supply curve of automobiles after regulation
FG: Clean up cost per unit
-According to Figure 12.2,the total clean up cost for the society prior to regulation is:
In the figure,
D: Demand curve for automobiles
S1: Supply curve of automobiles prior to regulation
S2: Supply curve of automobiles after regulation
FG: Clean up cost per unit
-According to Figure 12.2,the total clean up cost for the society prior to regulation is:
(Multiple Choice)
4.9/5 (49)
When the government borrows by having the Treasury Department sell IOUs or bonds to finance deficit,it is not considered as a public debt.
(True/False)
4.9/5 (33)
In an antitrust lawsuit,which of the following parties is entitled to receive treble damages?
(Multiple Choice)
5.0/5 (39)
Which of the following isnot a component of the index which measures economic freedom of a country?
(Multiple Choice)
4.7/5 (34)
Which of the following was formed in October 2001 to make the national antitrust laws more consistent across the developing and developed countries of the world?
(Multiple Choice)
4.7/5 (40)
The three phases of antitrust policy in the United States since 1890 are:
(Multiple Choice)
4.8/5 (40)
When regulating a natural monopoly,government officials face a dilemma that:
(Multiple Choice)
4.9/5 (38)
Which of the following calculations is necessary to determine whether a regulation should be implemented?
(Multiple Choice)
4.8/5 (38)
In the following figure,the first panel shows a market situation prior to regulation and the second panel shows the effects of regulation. Figure 12.2  In the figure,
D: Demand curve for automobiles
S1: Supply curve of automobiles prior to regulation
S2: Supply curve of automobiles after regulation
FG: Clean up cost per unit
-What is the total societal surplus prior to regulation described in Figure 12.2?
In the figure,
D: Demand curve for automobiles
S1: Supply curve of automobiles prior to regulation
S2: Supply curve of automobiles after regulation
FG: Clean up cost per unit
-What is the total societal surplus prior to regulation described in Figure 12.2?
(Multiple Choice)
4.9/5 (43)
A regulated natural monopoly is allowed to set a price which will enable it to earn an above-normal profit.
(True/False)
4.8/5 (33)
One necessary step in demonstrating monopolistic behavior is to define the market.In this process defendants would:
(Multiple Choice)
4.9/5 (40)
Filters
- Essay(0)
- Multiple Choice(0)
- Short Answer(0)
- True False(0)
- Matching(0)