Exam 8: Application: The Costs of Taxation
Exam 1: Ten Principles of Economics347 Questions
Exam 2: Thinking Like an Economist535 Questions
Exam 3: Interdependence and the Gains From Trade442 Questions
Exam 4: The Market Forces of Supply and Demand569 Questions
Exam 5: Elasticity and Its Application503 Questions
Exam 6: Supply, Demand, and Government Policies556 Questions
Exam 7: Consumers, Producers, and the Efficiency of Markets460 Questions
Exam 8: Application: The Costs of Taxation422 Questions
Exam 9: Application: International Trade409 Questions
Exam 10: Measuring a Nations Income428 Questions
Exam 11: Measuring the Cost of Living436 Questions
Exam 12: Production and Growth417 Questions
Exam 13: Saving, Investment, and the Financial System473 Questions
Exam 14: The Basic Tools of Finance419 Questions
Exam 15: Unemployment571 Questions
Exam 16: The Monetary System423 Questions
Exam 17: Money Growth and Inflation388 Questions
Exam 18: Open-Economy Macroeconomic Models448 Questions
Exam 19: A Macroeconomic Theory of the Open Economy374 Questions
Exam 20: Aggregate Demand and Aggregate Supply471 Questions
Exam 21: The Influence of Monetary and Fiscal Policy on Aggregate Demand416 Questions
Exam 22: The Short-Run Trade-Off Between Inflation and Unemployment400 Questions
Exam 23: Six Debates Over Macroeconomic Policy235 Questions
Select questions type
Anger over British taxes played a significant role in bringing about the
(Multiple Choice)
4.9/5  (36)
(36)
The higher a country's tax rates, the more likely that country will be
(Multiple Choice)
4.9/5 (29)
Figure 8-11 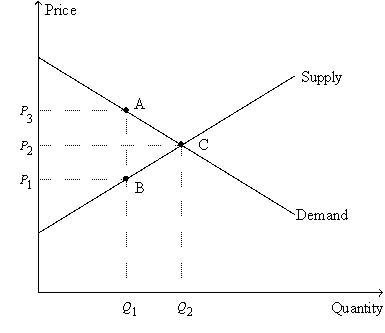 -Refer to Figure 8-11. The deadweight loss of the tax is represented by the
(Multiple Choice)
4.9/5 (36)
The size of a tax and the deadweight loss that results from the tax are
(Multiple Choice)
4.9/5 (35)
Consider a good to which a per-unit tax applies. The size of the deadweight that results from the tax is smaller, the
(Multiple Choice)
4.9/5 (44)
Figure 8-1 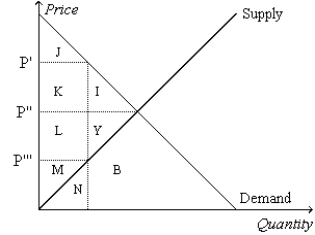 -Refer to Figure 8-1. Suppose the government imposes a tax of P' - P'''. The area measured by J+K+L+M represents
(Multiple Choice)
4.8/5 (37)
Figure 8-12 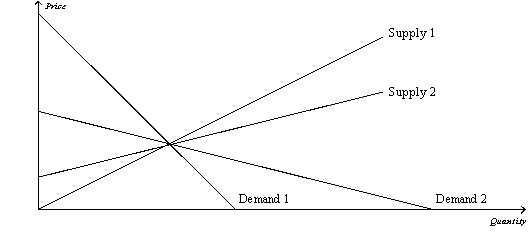 -Refer to Figure 8-12. Which of the following statements is correct?
(Multiple Choice)
4.7/5 (35)
Figure 8-6
The vertical distance between points A and B represents a tax in the market. 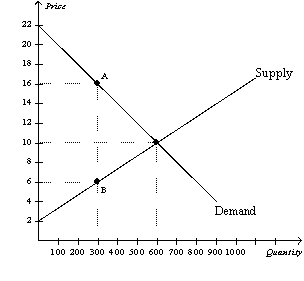 -Refer to Figure 8-6. When the government imposes the tax in this market, tax revenue is
(Multiple Choice)
4.9/5 (34)
Suppose the tax on gasoline is raised from $0.50 per gallon to $2.50 per gallon. As a result,
(Multiple Choice)
4.8/5 (32)
Figure 8-18 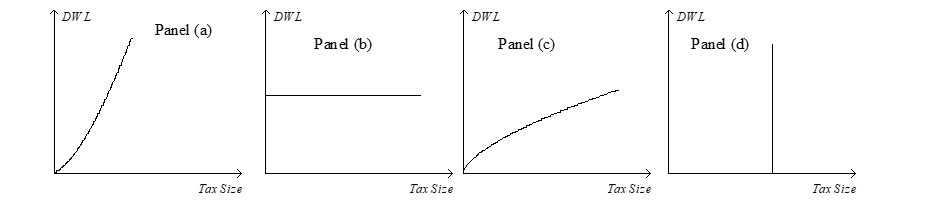 -Refer to Figure 8-18. Which graph correctly illustrates the relationship between the size of a tax and the size of the deadweight loss associated with the tax?
(Multiple Choice)
4.8/5 (36)
Scenario 8-1
Erin would be willing to pay as much as $100 per week to have her house cleaned. Ernesto's opportunity cost of cleaning Erin's house is $70 per week.
-Refer to Scenario 8-1. Assume Erin is required to pay a tax of $40 when she hires someone to clean her house for a week. Which of the following is correct?
(Multiple Choice)
4.8/5 (41)
Taxes on labor tend to increase the number of hours that people choose to work.
(True/False)
4.9/5 (29)
Figure 8-3
The vertical distance between points A and C represents a tax in the market. 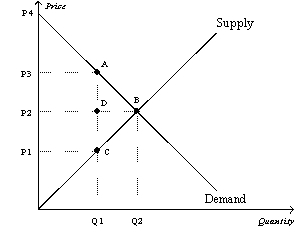 -Refer to Figure 8-3. Which of the following equations is valid for the deadweight loss of the tax?
(Multiple Choice)
4.8/5 (34)
Suppose a tax is imposed on the sellers of fast-food French fries. The burden of the tax will
(Multiple Choice)
4.9/5 (39)
Figure 8-6
The vertical distance between points A and B represents a tax in the market.
-Refer to Figure 8-6. Total surplus with the tax in place is
(Multiple Choice)
4.8/5 (43)
Figure 8-2
The vertical distance between points A and B represents a tax in the market. 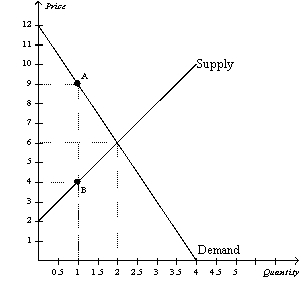 -Refer to Figure 8-2. Consumer surplus without the tax is
(Multiple Choice)
4.8/5 (33)
Taxes affect market participants by increasing the price paid by the buyer and decreasing the price received by the seller.
(True/False)
4.9/5 (44)
Figure 8-5
Suppose that the government imposes a tax of P3 - P1. 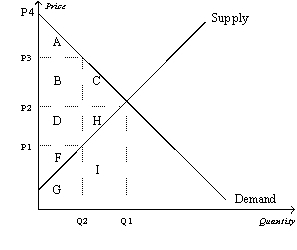 -Refer to Figure 8-5. The price that sellers effectively receive after the tax is imposed is
(Multiple Choice)
4.9/5 (32)
Filters
- Essay(0)
- Multiple Choice(0)
- Short Answer(0)
- True False(0)
- Matching(0)