Exam 7: Consumers, Producers, and the Efficiency of Markets
Exam 1: Ten Principles of Economics347 Questions
Exam 2: Thinking Like an Economist535 Questions
Exam 3: Interdependence and the Gains From Trade442 Questions
Exam 4: The Market Forces of Supply and Demand569 Questions
Exam 5: Elasticity and Its Application503 Questions
Exam 6: Supply, Demand, and Government Policies556 Questions
Exam 7: Consumers, Producers, and the Efficiency of Markets460 Questions
Exam 8: Application: The Costs of Taxation422 Questions
Exam 9: Application: International Trade409 Questions
Exam 10: Measuring a Nations Income428 Questions
Exam 11: Measuring the Cost of Living436 Questions
Exam 12: Production and Growth417 Questions
Exam 13: Saving, Investment, and the Financial System473 Questions
Exam 14: The Basic Tools of Finance419 Questions
Exam 15: Unemployment571 Questions
Exam 16: The Monetary System423 Questions
Exam 17: Money Growth and Inflation388 Questions
Exam 18: Open-Economy Macroeconomic Models448 Questions
Exam 19: A Macroeconomic Theory of the Open Economy374 Questions
Exam 20: Aggregate Demand and Aggregate Supply471 Questions
Exam 21: The Influence of Monetary and Fiscal Policy on Aggregate Demand416 Questions
Exam 22: The Short-Run Trade-Off Between Inflation and Unemployment400 Questions
Exam 23: Six Debates Over Macroeconomic Policy235 Questions
Select questions type
Ray buys a new tractor for $118,000. He receives consumer surplus of $13,000 on his purchase. Ray's willingness to pay is
Free
(Multiple Choice)
4.9/5  (38)
(38)
Correct Answer: Verified
D
Which of the following will cause a decrease in producer surplus?
Free
(Multiple Choice)
4.8/5 (27)
Correct Answer:Verified
A
Economists normally assume people's preferences should be
Free
(Multiple Choice)
4.9/5 (43)
Correct Answer:Verified
A
Figure 7-12 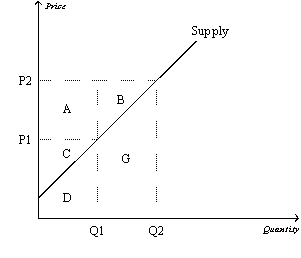 -Refer to Figure 7-12. When the price rises from P1 to P2, which area represents the increase in producer surplus to existing producers?
(Multiple Choice)
4.8/5 (43)
Figure 7-3 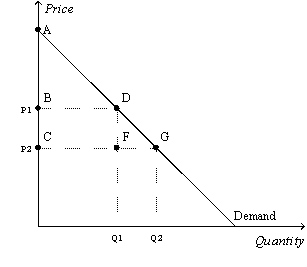 -Refer to Figure 7-3. When the price falls from P1 to P2, which area represents the increase in consumer surplus to existing buyers?
(Multiple Choice)
4.9/5 (27)
Table 7-11
Price Quantity Demanded Quantity Supplied \ 12.00 0 36 \ 10.00 3 30 \ 8.00 6 24 \ 6.00 9 18 \ 4.00 12 12 \ 2.00 15 6 \ 0.00 18 0
-Refer to Table 7-11. At a price of $2.00, total surplus is
(Multiple Choice)
4.8/5 (25)
Which of the following will cause a decrease in consumer surplus?
(Multiple Choice)
4.8/5 (40)
The current policy on kidney donation effectively sets a price ceiling of zero.
(True/False)
4.8/5 (41)
Tom tunes pianos in his spare time for extra income. Buyers of his service are willing to pay $155 per tuning. One particular week, Tom is willing to tune the first piano for $120, the second piano for $125, the third piano for $140, and the fourth piano for $160. Assume Tom is rational in deciding how many pianos to tune. His producer surplus is
(Multiple Choice)
4.9/5 (37)
Which of the following is true when the price of a good or service rises?
(Multiple Choice)
4.8/5 (38)
Table 7-4
The numbers in Table 7-1 reveal the maximum willingness to pay for a ticket to a Chicago Cubs vs. St. Louis Cardinal's baseball game at Wrigley Field. Buyer Willingnes to Pay Jenrifer \ 10 Bryce \ 15 Dan \ 20 David \ 25 Ker \ 50 Lisa \ 60
-Refer to Table 7-4. If tickets sell for $25 each, then what is the total consumer surplus in the market?
(Multiple Choice)
4.7/5 (34)
Figure 7-8 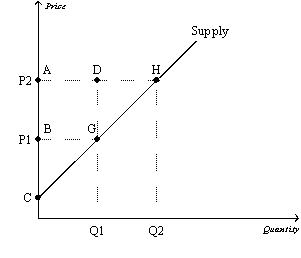 -Refer to Figure 7-8. When the price rises from P1 to P2, which area represents the increase in producer surplus to existing producers?
(Multiple Choice)
4.9/5 (36)
Table 7-8
The only four producers in a market have the following costs:
Sallar Cast Evar \ 50 Selana \ 100 Angie \ 150 Kris \ 200
-Refer to Table 7-8. If the sellers bid against each other for the right to sell the good to a consumer, then the producer surplus will be
(Multiple Choice)
4.7/5 (29)
Figure 7-19 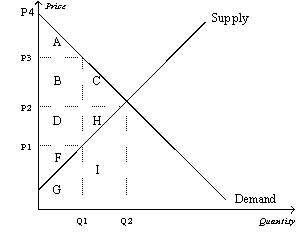 -Refer to Figure 7-19. If the price were P1, producer surplus would be represented by the area
(Multiple Choice)
4.7/5 (36)
Table 7-10
Seller Cost Lepran \ 700 Kabe \ 600 Kevin \ 450 Steve \ 400
-Refer to Table 7-10. You want to hire a professional photographer to take pictures of your family. The table shows the costs of the four potential sellers in the local photography market. Which of the following graphs represents the market supply curve?
(Multiple Choice)
4.8/5 (33)
If the government allowed a free market for transplant organs such as kidneys to exist, critics argue that such a market would
(Multiple Choice)
4.8/5 (36)
Table 7-1
Buger Willingnits Ta Raz Lari \ 50.00 Audrey \ 30.00 Zach \ 20.00 Calvin \ 10.00
-Refer to Table 7-1. If the price of the product is $15, then who would be willing to purchase the product?
(Multiple Choice)
4.7/5 (31)
Figure 7-15  -Refer to Figure 7-15. At the equilibrium price, total surplus is
(Multiple Choice)
4.8/5 (30)
When the supply of a good increases and the demand for the good remains unchanged, consumer surplus
(Multiple Choice)
4.9/5 (35)
Filters
- Essay(0)
- Multiple Choice(0)
- Short Answer(0)
- True False(0)
- Matching(0)