Exam 9: Demand for Goods and Supply of Labor and Capital
Assuming the same sized substitution effect, normal goods have steeper cross-price demand curves than inferior goods.
True
Consider a consumer who consumes only  and
and  .The price of
  falls.
a.On a graph with
falls.
a.On a graph with  on the horizontal and
  on the vertical axis, illustrate the change in this consumer's budget constraint assuming exogenous income I.
b.Illustrate income and substitution effects for
on the vertical axis, illustrate the change in this consumer's budget constraint assuming exogenous income I.
b.Illustrate income and substitution effects for  assuming that both goods are normal.
c.Can you tell whether the cross-price demand curve for
assuming that both goods are normal.
c.Can you tell whether the cross-price demand curve for  is upward or downward sloping?
d.Suppose
is upward or downward sloping?
d.Suppose  is leisure hours and
  is a composite consumption good.Consider an increase in the wage assuming a fixed endowment of leisure (and no exogenous source of income).How is your graph similar and how is it different from what you graphed in (a) through (c)?
e.Is the leisure-demand curve a cross-price demand curve? Why or why not?
is a composite consumption good.Consider an increase in the wage assuming a fixed endowment of leisure (and no exogenous source of income).How is your graph similar and how is it different from what you graphed in (a) through (c)?
e.Is the leisure-demand curve a cross-price demand curve? Why or why not?
a. This is illustrated with the two solid lines in the top panels of the graph.
b. The substitution effect is indicated in each of the top panels --- the income effect points in the opposite direction. On the vertical axis, the income effect implies C must lie above B.
c. No -- it depends on how large the substitution effect is relative to the income effect (as shown in the graphs). 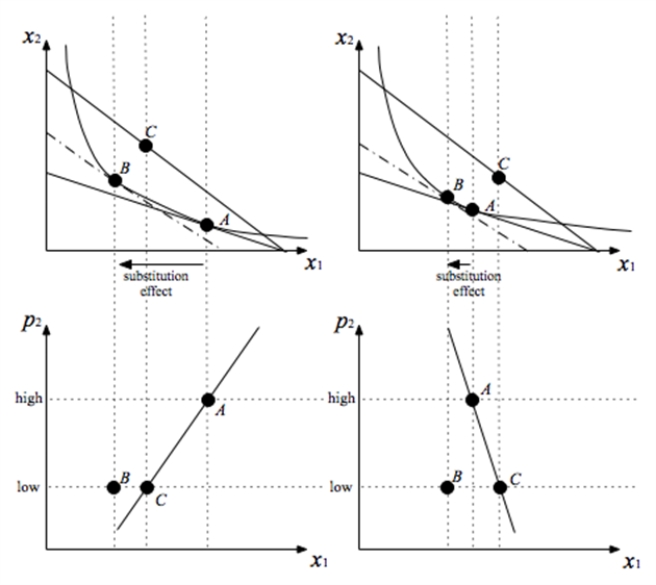 d. The top graphs would be identical. But the bottom graphs are not -- because the wage appears on the vertical axis, and the wage is not the same as the price of consumption.
 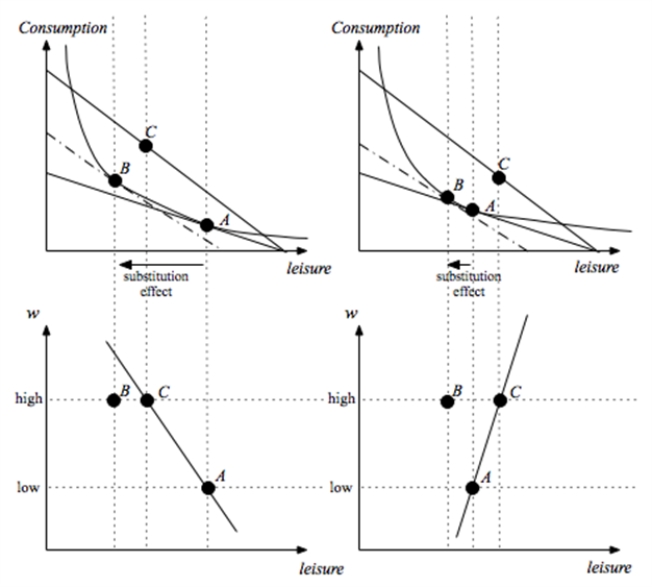 e. Not quite. The wage is not the price of consumption -- the good on the vertical axis in the top panels. Rather, the wage is the price of leisure. The models differ in that there is an exogenous income in the first case and an endogenous budget (derived from the leisure endowment) in the second case. But, when viewed as if the leisure demand curve arose from a model with exogenous income, an increase in the wage looks like a decrease in the price of consumption.
The cross-price demand curve for Cobb-Douglas tastes is perfectly vertical.
True
In order for someone to switch from borrowing to saving when the interest rate falls, it must be that current consumption is an inferior good.
For the same sized substitution effect, own-price demand curves for inferior goods are steeper than own price demand curves for normal goods.
If tastes are homothetic in leisure and consumption, labor supply curves slope up.
Holding all prices fixed, income-demand curves relate changes in exogenous income to changes in the quantity of a good demanded.
The empirically observed backward-bending labor supply curve cannot arise from homothetic tastes.
Leisure being an inferior good is necessary but not sufficient for labor supply to slope up.
Since income and substitution effects point in the same direction for normal goods, the leisure demand curve will be shallower if leisure is a normal good than if leisure is an inferior good.
When tastes are quasilinear in leisure, the labor supply curve is vertical.
Suppose your tastes over consumption and leisure have constant elasticity of substitution.I observe that, when your wage went up, you continued to work the same number of hours.From this, I can conclude that you have Cobb-Douglas tastes.
An increase in the price of good 2 will cause the demand curve for good 1 to shift out.
A downward sloping income-demand curve indicates that the good is a necessity.
If future consumption is a normal good, the interest rate/borrowing relationship cannot be upward sloping.
Suppose that utility over consumption and leisure takes the constant elasticity of substitution form 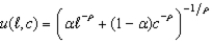 .If
.If  falls between 0 and -1, then the labor supply curve is backward bending.
Leisure being a normal good is neither necessary nor sufficient for labor supply to slope up.
Goods like exclusive designer clothes carry with them prestige value linked to their price.As a result, some people demand more of such goods as the price increases.For those people, such goods are Giffen goods.
If a good is quasilinear, its own-price demand curve is vertical.
Suppose your tastes can be represented by the utility function 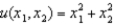 .Your demand for
  is
is
Filters
- Essay(0)
- Multiple Choice(0)
- Short Answer(0)
- True False(0)
- Matching(0)