Exam 5: Applying Consumer Theory
Exam 1: Introduction50 Questions
Exam 2: Supply and Demand141 Questions
Exam 3: Applying the Supply and Demand Model114 Questions
Exam 4: Consumer Choice115 Questions
Exam 5: Applying Consumer Theory108 Questions
Exam 6: Firms and Production117 Questions
Exam 7: Costs114 Questions
Exam 8: Competitive Firms and Markets117 Questions
Exam 9: Applying the Competitive Model146 Questions
Exam 10: General Equilibrium and Economic Welfare112 Questions
Exam 11: Monopoly138 Questions
Exam 12: Pricing and Advertising125 Questions
Exam 13: Oligopoly and Monopolistic Competition118 Questions
Exam 14: Game Theory99 Questions
Exam 15: Factor Markets93 Questions
Exam 16: Interest Rates, Investments, and Capital Markets110 Questions
Exam 17: Uncertainty112 Questions
Exam 18: Externalities, Open-Access, and Public Goods113 Questions
Exam 19: Asymmetric Information109 Questions
Exam 20: Contracts and Moral Hazards97 Questions
Select questions type
If the Engel curve for a good is upward sloping,the demand curve for that good must be downward sloping.
(True/False)
4.8/5  (37)
(37)
Draw a graph with Goods Per Day on the vertical axis and Leisure Hours Per Day increasing from left to right on the horizontal axis.Show that a person who works can work fewer hours and increase utility when the wage rate increases.
(Essay)
4.9/5 (37)
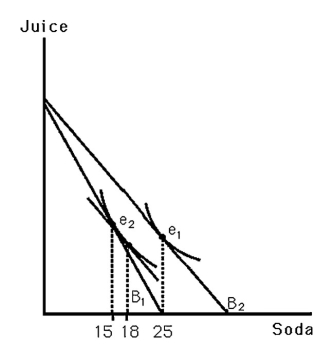 -The above figure shows Bobby's indifference map for soda and juice.B1 indicates his original budget line.B2 indicates his budget line resulting from a decrease in the price of soda.What change in quantity best represents his income effect?
(Multiple Choice)
4.9/5 (39)
The Consumer Price Index (CPI)measures inflation for every individual.
(Multiple Choice)
4.8/5 (37)
Suppose that the interest rate paid to savers increases.As a result,Tom wishes to save less.This suggests that,for Tom,
(Multiple Choice)
4.7/5 (38)
Ten individuals have $100 and identical preferences for picnics,p,and kayak trips,k,where U(p,k)= k0.5p0.5.The price of picnics is $5 and the price per kayak trip is $ 10.What is the shortage/surplus in the market when the supply of picnics totals 120?
(Multiple Choice)
4.9/5 (36)
Explain what the slope of the income consumption curve shows about the income elasticity of demand.
(Essay)
4.8/5 (45)
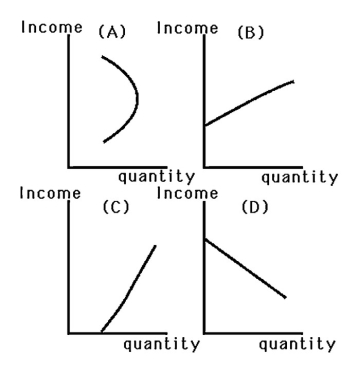 -Even though Mary's income is very low,she makes sure that she purchases enough milk for her family to drink.As her income rises,she does buy more milk.Which graph in the above figure best represents Mary's Engel curve for milk?
(Multiple Choice)
4.7/5 (36)
Deriving Demand Curves
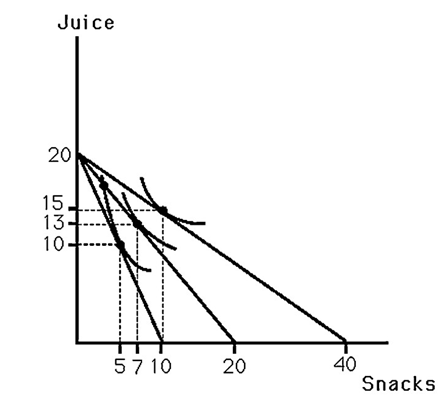 -The above figure shows Bobby's indifference map for juice and snacks.Also shown are three budget lines resulting from different prices for snacks.As the price of snacks rises,the price for juice
(Multiple Choice)
4.9/5 (35)
If a person supplies fewer hours of labor in response to a wage increase,then
(Multiple Choice)
4.8/5 (37)
A Consumer Price Index (CPI)adjustment overcompensates for inflation because it ignores
(Multiple Choice)
4.7/5 (37)
If a consumer is compensated for the income effect that occurs when the price of a good increases,then his demand curves can never slope upward.
(True/False)
4.9/5 (42)
If a person supplies more hours of labor in response to a wage increase,then
(Multiple Choice)
4.8/5 (35)
Empirical studies have found that the labor supply curves for most parts of the population are
(Multiple Choice)
5.0/5 (37)
When the price of a good changes,the income effect can be found by comparing the equilibrium quantities purchased
(Multiple Choice)
4.8/5 (30)
Suppose that the interest rate paid to savers increases.As a result,Tom wishes to save more.This suggests that,for Tom,
(Multiple Choice)
4.9/5 (27)
If consumer income and prices increase by the same percentage,
(Multiple Choice)
4.8/5 (32)
Filters
- Essay(0)
- Multiple Choice(0)
- Short Answer(0)
- True False(0)
- Matching(0)