Exam 5: Applying Consumer Theory
Exam 1: Introduction50 Questions
Exam 2: Supply and Demand141 Questions
Exam 3: Applying the Supply and Demand Model114 Questions
Exam 4: Consumer Choice115 Questions
Exam 5: Applying Consumer Theory108 Questions
Exam 6: Firms and Production117 Questions
Exam 7: Costs114 Questions
Exam 8: Competitive Firms and Markets117 Questions
Exam 9: Applying the Competitive Model146 Questions
Exam 10: General Equilibrium and Economic Welfare112 Questions
Exam 11: Monopoly138 Questions
Exam 12: Pricing and Advertising125 Questions
Exam 13: Oligopoly and Monopolistic Competition118 Questions
Exam 14: Game Theory99 Questions
Exam 15: Factor Markets93 Questions
Exam 16: Interest Rates, Investments, and Capital Markets110 Questions
Exam 17: Uncertainty112 Questions
Exam 18: Externalities, Open-Access, and Public Goods113 Questions
Exam 19: Asymmetric Information109 Questions
Exam 20: Contracts and Moral Hazards97 Questions
Select questions type
An individual derives utility from consuming "all other goods," g,and clean air (measured by the reduction in particulate matter per m3),a,as measured by the utility function U(g,a)= g0.6a0.4.The price of consumer goods equals $20 and the price of clean air (abatement)equals $10.What is the slope of the Engel curve when income increases from $100 to $200?
Free
(Multiple Choice)
4.9/5  (35)
(35)
Correct Answer: Verified
A
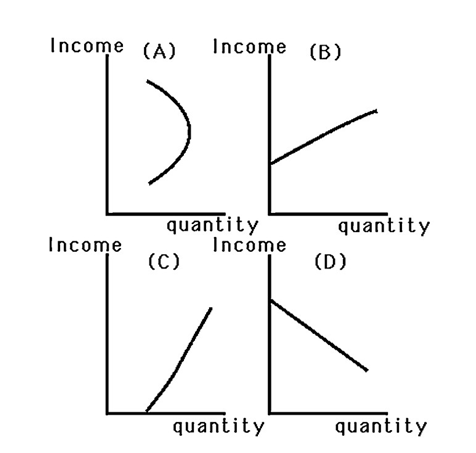 -When John was in college and his income was low,he drank "Red Ribbon" beer.As his income increased,he purchased better-quality beer and less "Red Ribbon." Which graph in the above figure best represents John's Engel curve for "Red Ribbon" beer?
Free
(Multiple Choice)
4.7/5 (26)
Correct Answer:Verified
A
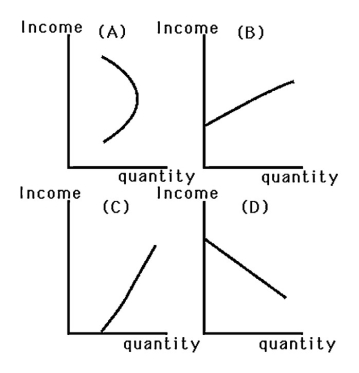 -When John's income was low,he could not afford to dine out and would respond to a pay raise by purchasing more frozen dinners.Now that his income is high,a pay raise causes him to dine out more often and buy fewer frozen dinners.Which graph in the above figure best represents John's Engel curve for frozen dinners?
Free
(Multiple Choice)
4.9/5 (41)
Correct Answer:Verified
A
When income increases by 1%,the quantity demanded of a good decreases by 2%.What is the income elasticity of the good? Is the good normal or inferior? Why?
(Essay)
4.9/5 (44)
Recent data has shown that income and volunteer time are positively related.Assuming that volunteer time is included in leisure time,what could explain this observation?
(Multiple Choice)
4.8/5 (30)
Using a Laspeyres index to calculate the Consumer Price Index (CPI)
(Multiple Choice)
4.9/5 (38)
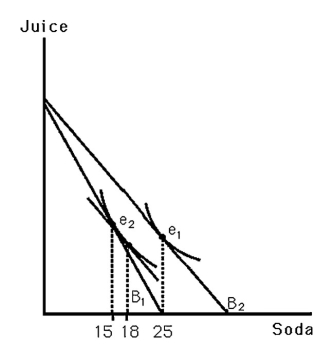 -The above figure shows Bobby's indifference map for soda and juice.B1 indicates his original budget line.B2 indicates his budget line resulting from an increase in the price of soda.From the graph,one can conclude that
(Multiple Choice)
4.8/5 (42)
What is the slope of the price consumption curve for two goods,x and y,when preferences are measured by the utility function U(x,y)= x0.5y0.5,the price of good y is $10,income equals $100,and the price of good x increases from $5 to $10?
(Multiple Choice)
4.8/5 (36)
Many manufacturers sell products labeled as having imperfections at a discount at their factory outlets but do not ship these imperfect goods to regular retail outlets.Why?
(Essay)
4.8/5 (36)
Consider two lottery winners,Tino who is 65 years old and Sasha who is 32 years old.Which of these two would be expected to have the larger income effect,all else equal?
(Multiple Choice)
4.9/5 (33)
Under which of the following conditions will there be no substitution bias in the CPI?
(Multiple Choice)
4.7/5 (31)
Deriving Demand Curves
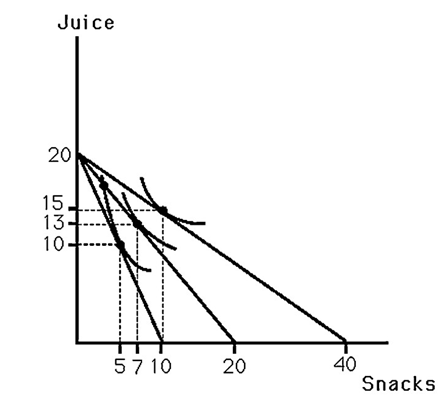 -The above figure shows Bobby's indifference map for juice and snacks.Also shown are three budget lines resulting from different prices for snacks.This information could be used to determine
(Multiple Choice)
4.7/5 (29)
When measuring the substitution effect,one uses the change along
(Multiple Choice)
4.8/5 (34)
Both Sally and Sam receive a 10% raise in a single year.Sally increases her demand for ground beef whereas Sam decreases his demand for ground beef.
(Multiple Choice)
4.8/5 (37)
The Slutsky equation shows that,holding the total effect constant,the income effect will be larger for goods that
(Multiple Choice)
4.9/5 (28)
Median household income is $50,000 per year.The typical household spends about $125 per year on milk,which has an income elasticity of about 0.07.From this information,we can conclude that
(Multiple Choice)
4.9/5 (40)
Suppose that frozen dinners were once a normal good for John,but now frozen dinners are an inferior good for him.John's demand curve for frozen dinners
(Multiple Choice)
4.9/5 (37)
Filters
- Essay(0)
- Multiple Choice(0)
- Short Answer(0)
- True False(0)
- Matching(0)