Exam 9: Applying the Competitive Model
Exam 1: Introduction50 Questions
Exam 2: Supply and Demand141 Questions
Exam 3: Applying the Supply and Demand Model114 Questions
Exam 4: Consumer Choice115 Questions
Exam 5: Applying Consumer Theory108 Questions
Exam 6: Firms and Production117 Questions
Exam 7: Costs114 Questions
Exam 8: Competitive Firms and Markets117 Questions
Exam 9: Applying the Competitive Model146 Questions
Exam 10: General Equilibrium and Economic Welfare112 Questions
Exam 11: Monopoly138 Questions
Exam 12: Pricing and Advertising125 Questions
Exam 13: Oligopoly and Monopolistic Competition118 Questions
Exam 14: Game Theory99 Questions
Exam 15: Factor Markets93 Questions
Exam 16: Interest Rates, Investments, and Capital Markets110 Questions
Exam 17: Uncertainty112 Questions
Exam 18: Externalities, Open-Access, and Public Goods113 Questions
Exam 19: Asymmetric Information109 Questions
Exam 20: Contracts and Moral Hazards97 Questions
Select questions type
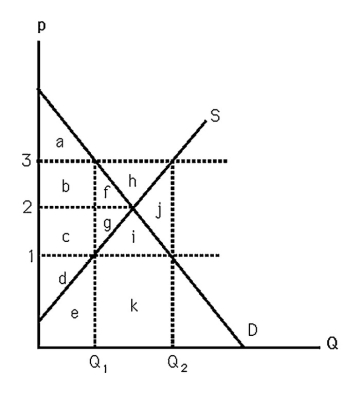 -The above figure shows supply and demand curves for milk.If amount Q2 is produced in the market,
(Multiple Choice)
4.8/5  (31)
(31)
As the price of a good increases,the loss in consumer surplus is larger,
(Multiple Choice)
4.7/5 (34)
Policies that restrict supply could generate an increase in social welfare because the increase in producer surplus could exceed the decrease in consumer surplus.
(True/False)
4.8/5 (30)
Suppose the market supply curve is p = 5 + Q.At a price of 10,producer surplus equals
(Multiple Choice)
4.8/5 (42)
Does a competitive long-run equilibrium require cost-minimization?
(Multiple Choice)
4.8/5 (44)
Assume the price of tomatoes increases.Which of the following causes would correspond to greater producer surplus?
(Multiple Choice)
4.8/5 (38)
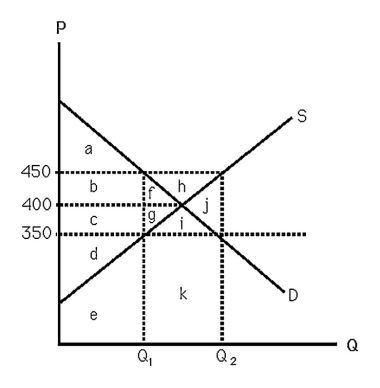 -The above figure shows supply and demand curves for apartment units in a large city.If the city government passes a law that establishes $350 per month as the legal maximum rent,deadweight loss occurs because
(Multiple Choice)
4.8/5 (34)
In the long run,competitive firms MUST be profit maximizers because if they do not maximize profits,
(Multiple Choice)
4.9/5 (43)
If activists successfully lobbied government to force firms to produce more output than they normally would in a perfectly competitive market,
(Multiple Choice)
4.8/5 (26)
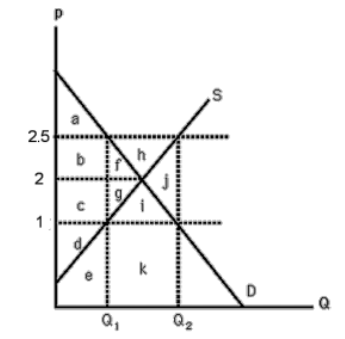 -The above figure shows the market for rice in Japan where price is expressed in dollars.S represents the domestic supply curve,and the horizontal line at P = $1 represents the world supply curve.Currently Q1 units are imported.The loss from shifting production from foreign to domestic producers equals
(Multiple Choice)
4.7/5 (34)
You enter a store and buy a bottle of soda.Do you usually receive consumer surplus?
(Multiple Choice)
4.8/5 (37)
-The above figure shows supply and demand curves for milk.In an effort to help farmers,the government passes a law that establishes a $3 per gallon price support.As a result,consumer surplus falls by
(Multiple Choice)
4.9/5 (28)
 -The above figure shows the market for rice in Japan where price is expressed in dollars.S represents the domestic supply curve,and the horizontal line at P = 1 represents the world supply curve.Suppose a free market exists.If a $1 per unit tariff is imposed on imported rice,the quantity of imported rice will decrease by
(Multiple Choice)
4.9/5 (35)
If a firm is in a perfectly competitive world but decides to charge a higher price than its competitors,
(Multiple Choice)
4.9/5 (26)
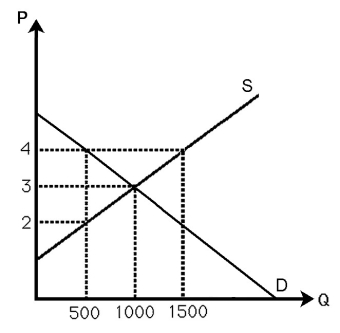 -The above figure shows the demand and supply curves in the market for milk.Currently the market is in equilibrium.If the government imposes a $2 per gallon tax to be collected from sellers,estimate the change in p,Q,and social welfare.
(Essay)
4.9/5 (34)
-The above figure shows supply and demand curves for milk.Suppose that the government passes a $2 per gallon subsidy.The deadweight loss resulting from this policy will be
(Multiple Choice)
4.8/5 (37)
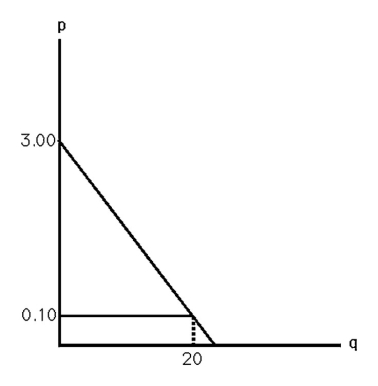 -Figure 9.6 shows an individual's demand curve for time per month spent telecommunicating while driving (talking on the car phone.)A car phone is useless except for talking with somebody who is not in the car.If calls are priced at ten cents per minute,what is the consumer surplus derived from talking? What is the most this person would pay for the car phone? Explain.
(Essay)
4.8/5 (36)
The deadweight loss associated with output less than the competitive level can be determined by
(Multiple Choice)
4.9/5 (34)
Filters
- Essay(0)
- Multiple Choice(0)
- Short Answer(0)
- True False(0)
- Matching(0)