Exam 34: The Influence of Monetary and Fiscal Policy on Aggregate Demand
Exam 1: Ten Principles of Economics281 Questions
Exam 2: Thinking Like an Economist451 Questions
Exam 3: Interdependence and the Gains From Trade353 Questions
Exam 4: The Market Forces of Supply and Demand467 Questions
Exam 5: Elasticity and Its Application409 Questions
Exam 6: Supply, Demand, and Government Policies459 Questions
Exam 7: Consumers, Producers, and the Efficiency of Markets363 Questions
Exam 8: Application: The Costs of Taxation353 Questions
Exam 9: Application: International Trade333 Questions
Exam 10: Externalities352 Questions
Exam 11: Public Goods and Common Resources270 Questions
Exam 12: The Design of the Tax System397 Questions
Exam 13: The Costs of Production434 Questions
Exam 14: Firms in Competitive Markets381 Questions
Exam 15: Monopoly427 Questions
Exam 16: Monopolistic Competition416 Questions
Exam 17: Oligopoly325 Questions
Exam 18: The Markets for the Factors of Production361 Questions
Exam 19: Earnings and Discrimination335 Questions
Exam 20: Income Inequality and Poverty312 Questions
Exam 21: The Theory of Consumer Choice354 Questions
Exam 22: Frontiers of Microeconomics262 Questions
Exam 23: Measuring a Nations Income343 Questions
Exam 24: Measuring the Cost of Living358 Questions
Exam 25: Production and Growth335 Questions
Exam 26: Saving, investment, and the Financial System381 Questions
Exam 27: The Basic Tools of Finance336 Questions
Exam 28: Unemployment533 Questions
Exam 29: The Monetary System366 Questions
Exam 30: Money Growth and Inflation312 Questions
Exam 31: Open-Economy Macroeconomics: Basic Concepts346 Questions
Exam 32: A Macroeconomic Theory of the Open Economy300 Questions
Exam 33: Aggregate Demand and Aggregate Supply386 Questions
Exam 34: The Influence of Monetary and Fiscal Policy on Aggregate Demand334 Questions
Exam 35: The Short-Run Trade-Off Between Inflation and Unemployment306 Questions
Exam 36: Five Debates Over Macroeconomic Policy179 Questions
Select questions type
Figure 34-2.On the left-hand graph,MS represents the supply of money and MD represents the demand for money;on the right-hand graph,AD represents aggregate demand.The usual quantities are measured along the axes of both graphs.
 -Refer to Figure 34-2.If the money-supply curve MS on the left-hand graph were to shift to the right,this would
(Multiple Choice)
4.9/5  (39)
(39)
The price of imported oil rises.If the government wanted to stabilize output,which of the following could it do?
(Multiple Choice)
4.9/5 (39)
When the Fed sells government bonds,the reserves of the banking system
(Multiple Choice)
4.8/5 (40)
The government builds a new water-treatment plant.The owner of the company that builds the plant pays her workers.The workers increase their spending.Firms from which the workers buy goods increase their output.This type of effect on spending illustrates
(Multiple Choice)
4.9/5 (39)
When the Fed increases the money supply,the interest rate decreases.This decrease in the interest rate increases consumption and investment demand,so the aggregate-demand curve shifts to the right.
(True/False)
4.9/5 (37)
Suppose that the MPC is 0.60;there is no investment accelerator;and there are no crowding-out effects.If government expenditures increase by $25 billion,then aggregate demand
(Multiple Choice)
4.7/5 (34)
If,at some interest rate,the quantity of money supplied is greater than the quantity of money demanded,people will desire to
(Multiple Choice)
4.9/5 (34)
In a certain economy,when income is $200,consumer spending is $145.The value of the multiplier for this economy is 6.25.It follows that,when income is $230,consumer spending is
(Multiple Choice)
4.9/5 (40)
Figure 34-1 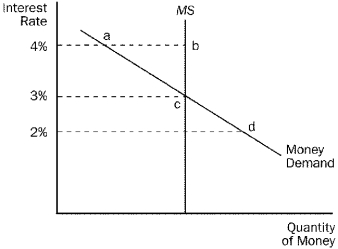 -Refer to Figure 34-1.If the current interest rate is 2 percent,
(Multiple Choice)
4.8/5 (41)
Figure 34-2.On the left-hand graph,MS represents the supply of money and MD represents the demand for money;on the right-hand graph,AD represents aggregate demand.The usual quantities are measured along the axes of both graphs.
-Refer to Figure 34-2.What does Y represent on the horizontal axis of the right-hand graph?
(Multiple Choice)
4.8/5 (40)
People are likely to want to hold more money if the interest rate
(Multiple Choice)
4.9/5 (37)
In which of the following cases would the quantity of money demanded be smallest?
(Multiple Choice)
4.8/5 (38)
Explain why the interest rate is the opportunity cost of holding currency.What is the benefit of holding currency?
(Essay)
4.8/5 (43)
Figure 34-5.On the left-hand graph,MS represents the supply of money and MD represents the demand for money;on the right-hand graph,AD represents aggregate demand.The usual quantities are measured along the axes of both graphs.
 -Refer to Figure 34-5.Suppose the multiplier is 5 and the government increases its purchases by $10 billion.Also,suppose the AD curve would shift from AD1 to AD2 if there were no crowding out;the AD curve actually shifts from AD1 to AD3 with crowding out.Also,suppose the horizontal distance between the curves AD1 and AD3 is $20 billion.The extent of crowding out,for any particular level of the price level,is
(Multiple Choice)
4.9/5 (35)
The theory of liquidity preference illustrates the principle that
(Multiple Choice)
4.8/5 (33)
Filters
- Essay(0)
- Multiple Choice(0)
- Short Answer(0)
- True False(0)
- Matching(0)