Exam 34: The Influence of Monetary and Fiscal Policy on Aggregate Demand
Exam 1: Ten Principles of Economics281 Questions
Exam 2: Thinking Like an Economist451 Questions
Exam 3: Interdependence and the Gains From Trade353 Questions
Exam 4: The Market Forces of Supply and Demand467 Questions
Exam 5: Elasticity and Its Application409 Questions
Exam 6: Supply, Demand, and Government Policies459 Questions
Exam 7: Consumers, Producers, and the Efficiency of Markets363 Questions
Exam 8: Application: The Costs of Taxation353 Questions
Exam 9: Application: International Trade333 Questions
Exam 10: Externalities352 Questions
Exam 11: Public Goods and Common Resources270 Questions
Exam 12: The Design of the Tax System397 Questions
Exam 13: The Costs of Production434 Questions
Exam 14: Firms in Competitive Markets381 Questions
Exam 15: Monopoly427 Questions
Exam 16: Monopolistic Competition416 Questions
Exam 17: Oligopoly325 Questions
Exam 18: The Markets for the Factors of Production361 Questions
Exam 19: Earnings and Discrimination335 Questions
Exam 20: Income Inequality and Poverty312 Questions
Exam 21: The Theory of Consumer Choice354 Questions
Exam 22: Frontiers of Microeconomics262 Questions
Exam 23: Measuring a Nations Income343 Questions
Exam 24: Measuring the Cost of Living358 Questions
Exam 25: Production and Growth335 Questions
Exam 26: Saving, investment, and the Financial System381 Questions
Exam 27: The Basic Tools of Finance336 Questions
Exam 28: Unemployment533 Questions
Exam 29: The Monetary System366 Questions
Exam 30: Money Growth and Inflation312 Questions
Exam 31: Open-Economy Macroeconomics: Basic Concepts346 Questions
Exam 32: A Macroeconomic Theory of the Open Economy300 Questions
Exam 33: Aggregate Demand and Aggregate Supply386 Questions
Exam 34: The Influence of Monetary and Fiscal Policy on Aggregate Demand334 Questions
Exam 35: The Short-Run Trade-Off Between Inflation and Unemployment306 Questions
Exam 36: Five Debates Over Macroeconomic Policy179 Questions
Select questions type
Depending on the size of the multiplier and crowding-out effects,the rightward shift in aggregate demand from a tax cut could be larger or smaller than the tax cut.
(True/False)
4.9/5  (36)
(36)
When the Fed announces a target for the federal funds rate,it essentially accommodates the day-to-day fluctuations in money demand by adjusting the money supply accordingly.
(True/False)
4.8/5 (43)
Which of the following is likely more important for explaining the slope of the aggregate-demand curve of a small economy than it is for the United States?
(Multiple Choice)
4.9/5 (43)
Figure 34-2.On the left-hand graph,MS represents the supply of money and MD represents the demand for money;on the right-hand graph,AD represents aggregate demand.The usual quantities are measured along the axes of both graphs.
 -Refer to Figure 34-2.Assume the money market is always in equilibrium.Under the assumptions of the model,
(Multiple Choice)
4.8/5 (37)
According to liquidity preference theory,a decrease in the price level causes the interest rate to
(Multiple Choice)
4.8/5 (28)
If the interest rate is above the Fed's target,the Fed should
(Multiple Choice)
4.8/5 (40)
In recent years,the Fed has chosen to target interest rates rather than the money supply because
(Multiple Choice)
4.8/5 (37)
Assume there is a multiplier effect,some crowding out,and no accelerator effect.An increase in government expenditures changes aggregate demand more,
(Multiple Choice)
4.9/5 (39)
With respect to their impact on aggregate demand for the U.S.economy,which of the following represents the correct ordering of the wealth effect,interest-rate effect,and exchange-rate effect from most important to least important?
(Multiple Choice)
4.7/5 (31)
Figure 34-2.On the left-hand graph,MS represents the supply of money and MD represents the demand for money;on the right-hand graph,AD represents aggregate demand.The usual quantities are measured along the axes of both graphs.
-Refer to Figure 34-2.Assume the money market is always in equilibrium.Under the assumptions of the model,
(Multiple Choice)
4.9/5 (46)
Suppose there were a large increase in net exports.If the Fed wanted to stabilize output,it could
(Multiple Choice)
4.8/5 (39)
Figure 34-5.On the left-hand graph,MS represents the supply of money and MD represents the demand for money;on the right-hand graph,AD represents aggregate demand.The usual quantities are measured along the axes of both graphs.
 -Refer to Figure 34-5.Suppose the multiplier is 3 and the government increases its purchases by $25 billion.Also,suppose the AD curve would shift from AD1 to AD2 if there were no crowding out;the AD curve actually shifts from AD1 to AD3 with crowding out.Finally,assume the horizontal distance between the curves AD1 and AD3 is $30 billion.The extent of crowding out,for any particular level of the price level,is
(Multiple Choice)
4.8/5 (25)
Figure 34-3. 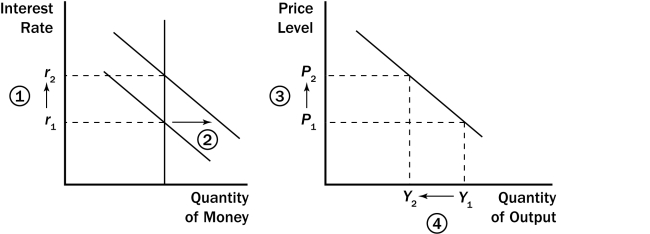 -Refer to Figure 34-3.What quantity is represented by the vertical line on the left-hand graph?
(Multiple Choice)
5.0/5 (30)
According to the liquidity preference theory,an increase in the overall price level of 10 percent
(Multiple Choice)
4.7/5 (34)
According to the theory of liquidity preference,which variable adjusts to balance the supply and demand for money?
(Multiple Choice)
4.8/5 (43)
Filters
- Essay(0)
- Multiple Choice(0)
- Short Answer(0)
- True False(0)
- Matching(0)