Exam 10: Aggregate Supply and Aggregate Demand
Exam 1: What Is Economics?479 Questions
Exam 2: The Economic Problem440 Questions
Exam 3: Demand and Supply515 Questions
Exam 4: Measuring GDP and Economic Growth395 Questions
Exam 5: Monitoring Jobs and Inflation407 Questions
Exam 6: Economic Growth353 Questions
Exam 7: Finance, Saving, and Investment225 Questions
Exam 8: Money, the Price Level, and Inflation578 Questions
Exam 9: The Exchange Rate and the Balance of Payments492 Questions
Exam 10: Aggregate Supply and Aggregate Demand428 Questions
Exam 11: Expenditure Multipliers469 Questions
Exam 12: The Business Cycle, Inflation, and Deflation410 Questions
Exam 13: Fiscal Policy263 Questions
Exam 14: Monetary Policy227 Questions
Exam 15: International Trade Policy200 Questions
Select questions type
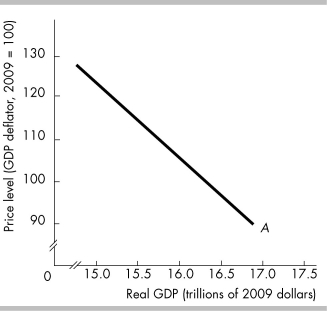 -In the above figure, the curve labeled A shifts rightward if
(Multiple Choice)
4.8/5  (42)
(42)
The level of output when there is full employment is called actual GDP.
(True/False)
4.9/5 (42)
If you have $5,000 in wealth and the price level decreases by 20 percent, then
(Multiple Choice)
4.9/5 (31)
Which school of thought believes that recessions are the result of inappropriate monetary policy?
(Multiple Choice)
4.8/5 (40)
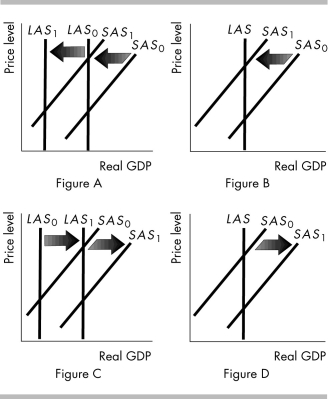 -In the above figure, which part corresponds to an increase in the money wage rate?
(Multiple Choice)
4.8/5 (39)
An aggregate supply curve depicts the relationship between
(Multiple Choice)
4.8/5 (40)
The table below shows data for India's economy. Real GDP is measured in millions of rupees.
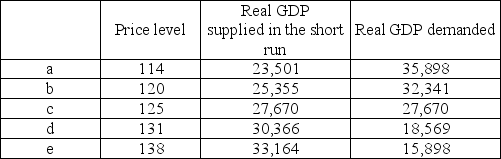 If potential GDP in India is ________ million rupees, India is experiencing ________.
(Multiple Choice)
4.8/5 (29)
Which of the following statements regarding aggregate supply are CORRECT?
(Multiple Choice)
4.7/5 (35)
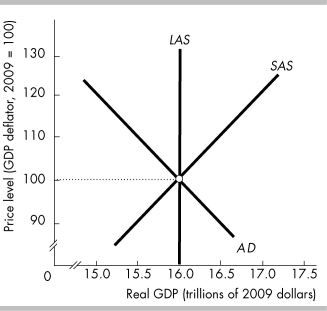 -The figure above illustrates aggregate demand and aggregate supply in Sparta. Sparta's price level will rise above 100 if ________.
(Multiple Choice)
5.0/5 (32)
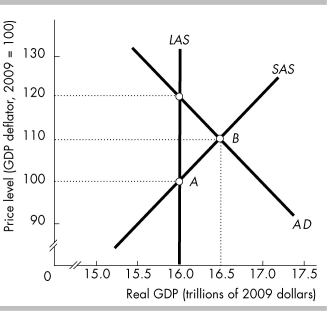 -In the above figure, suppose the economy had been at point A and now is at B. What could have led to the movement to B?
(Multiple Choice)
4.8/5 (28)
If the money prices of resources changes, the SAS curve shifts.
(True/False)
4.7/5 (28)
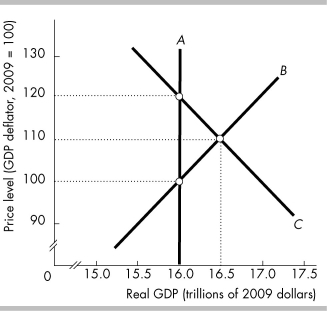 -In the above figure, curve A is the ________ curve, curve B is the ________ curve, and curve C is the ________ curve.
(Multiple Choice)
5.0/5 (33)
Suppose consumers decrease their consumption expenditure because they worry about what their income will be in the future. There is
(Multiple Choice)
4.9/5 (39)
Filters
- Essay(0)
- Multiple Choice(0)
- Short Answer(0)
- True False(0)
- Matching(0)