Exam 12: Simple Regression
Exam 1: Overview of Statistics52 Questions
Exam 2: Data Collection111 Questions
Exam 3: Describing Data Visually108 Questions
Exam 4: Descriptive Statistics150 Questions
Exam 5: Probability123 Questions
Exam 6: Discrete Probability Distributions126 Questions
Exam 7: Continuous Probability Distributions120 Questions
Exam 8: Sampling Distributions and Estimation106 Questions
Exam 9: One-Sample Hypothesis Tests147 Questions
Exam 10: Two-Sample Hypothesis Tests113 Questions
Exam 11: Analysis of Variance126 Questions
Exam 12: Simple Regression135 Questions
Exam 13: Multiple Regression130 Questions
Exam 14: Time Series Analysis114 Questions
Exam 15: Chi-Square Tests99 Questions
Exam 16: Nonparametric Tests85 Questions
Exam 17: Quality Management108 Questions
Select questions type
In a two-tailed test for correlation at α = .05, a sample correlation coefficient r = 0.42 with n = 25 is significantly different than zero.
(True/False)
4.8/5  (49)
(49)
Pedro became interested in vehicle fuel efficiency, so he performed a simple regression using 93 cars to estimate the model CityMPG = β0 + β1 Weight, where Weight is the weight of the vehicle in pounds. His results are shown below. Write a brief analysis of these results, using what you have learned in this chapter. Is the intercept meaningful in this regression? Make a prediction of CityMPG when Weight = 3000 and also when Weight = 4000. Do these predictions seem believable? If you could make a car 1000 pounds lighter, what change would you predict in its CityMPG?
Regression Analysis
0.711 n 93 r-0.843 k1 Std. Error 3.038 Dep. Var. CityMPG
Source SS df MS F p -value Regression 2,065.5191 1 2,065.5191 223.75 2.97-26 Residual 840.0508 91 9.2313 Total 2,905.5699 92
variables coefficients std. error t(df=91) p -value 95\% lower 95\% upper Intercept 47.0484 1.6799 28.006 1.63-46 43.7114 50.3853 Weight -0.0080 0.0005 -14.958 2.97-26 -0.0091 -0.0070
(Essay)
4.8/5 (32)
In a sample of n = 23, the Student's t test statistic for a correlation of r = .500 would be:
(Multiple Choice)
4.8/5 (39)
If R2 = .36 in the model Sales = 268 + 7.37 Ads, then Ads explains 36 percent of the variation in Sales.
(True/False)
4.8/5 (23)
In a simple bivariate regression with 60 observations, there will be _____ residuals.
(Multiple Choice)
4.9/5 (42)
When using the least squares method, the column of residuals always sums to zero.
(True/False)
4.8/5 (32)
The fitted intercept in a regression has little meaning if no data values near X = 0 have been observed.
(True/False)
5.0/5 (32)
Using a two-tailed test at α = .05 for n = 30, we would reject the hypothesis of zero correlation if the absolute value of r exceeds:
(Multiple Choice)
4.8/5 (30)
Which is not an assumed characteristic of εi in the population model yi = β0 + β1 xi + εi?
(Multiple Choice)
4.8/5 (45)
A variable transformation in a regression (e.g., replacing Y with log(Y)):
(Multiple Choice)
4.9/5 (42)
Find the slope of the simple regression = b0 + b1x. X Y 3 9 5 13 9 10 13 23 15 35
(Multiple Choice)
4.9/5 (32)
A scatter plot is used to visualize the association (or lack of association) between two quantitative variables.
(True/False)
4.9/5 (36)
The correlation coefficient r always has the same sign as b1 in Y = b0 + b1X.
(True/False)
4.8/5 (40)
In least squares regression, the residuals e1, e2,…, en will always have a zero mean.
(True/False)
4.9/5 (35)
Cause-and-effect direction between X and Y may be determined by running the regression twice and seeing whether Y = β0 + β1X or X = β1 + β0Y has the larger R2.
(True/False)
4.9/5 (40)
A local trucking company fitted a regression to relate the cost of its shipments as a function of the distance traveled. The Excel fitted regression is shown. 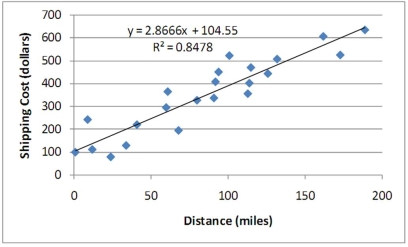 Based on this estimated relationship, when distance increases by 50 miles, the expected shipping cost would increase by:
(Multiple Choice)
4.9/5 (31)
In a simple regression, the F statistic is calculated by taking the ratio of MSR to the MSE.
(True/False)
4.8/5 (36)
Pearson's correlation coefficient (r) requires that both variables be interval or ratio data.
(True/False)
4.7/5 (32)
In a simple regression, if the coefficient for X is positive and significantly different from zero, then an increase in X is associated with an increase in the mean (i.e., the expected value) of Y.
(True/False)
4.9/5 (47)
Filters
- Essay(0)
- Multiple Choice(0)
- Short Answer(0)
- True False(0)
- Matching(0)