Exam 3: Central Tendency
Exam 1: Introduction to Statistics76 Questions
Exam 2: Frequency Distributions74 Questions
Exam 3: Central Tendency75 Questions
Exam 4: Variability75 Questions
Exam 5: Z-Scores: Location of Scores and Standardized Distributions77 Questions
Exam 6: Probability76 Questions
Exam 7: Probability and Samples: the Distribution of Sample Means77 Questions
Exam 8: Introduction to Hypothesis Testing76 Questions
Exam 9: Introduction to the T Statistic74 Questions
Exam 10: The T Test for Two Independent Samples75 Questions
Exam 11: The T Test for Two Related Samples76 Questions
Exam 12: Introduction to Analysis of Variance74 Questions
Exam 13: Repeated-Measures Analysis of Variance Anova75 Questions
Exam 14: Two-Factor Analysis of Variance Independent Measures75 Questions
Exam 15: Correlation76 Questions
Exam 16: Introduction to Regression75 Questions
Exam 17: The Chi-Square Statistic: Tests for Goodness of Fit and Independence75 Questions
Exam 18: The Binomial Test75 Questions
Select questions type
A population with a mean of µ = 6 has ΣX = 42.How many scores are in the population?
Free
(Multiple Choice)
4.7/5  (34)
(34)
Correct Answer: Verified
B
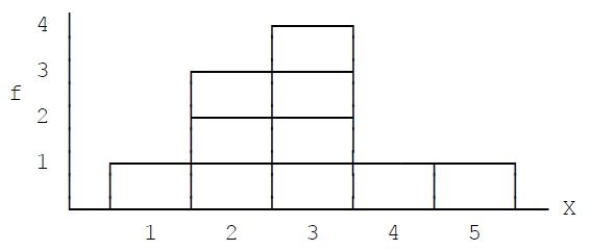 Figure 3.1
-Find the mean,the median,and the mode for the set of scores in the accompanying frequency distribution histogram,Figure 3.1.
Figure 3.1
-Find the mean,the median,and the mode for the set of scores in the accompanying frequency distribution histogram,Figure 3.1.
Free
(Essay)
4.8/5 (37)
Correct Answer:Verified
Mean = 28/10 = 2.80.By simply counting,the median = 3.The precise median is 2.75.Mode = 3
Every dataset will have a mode.
Free
(True/False)
4.7/5 (39)
Correct Answer:Verified
False
What is the value of the median for the following set of scores? Scores: 1,3,4,6,7,8,12,23
(Multiple Choice)
4.8/5 (30)
For a negatively skewed distribution with a mode of X = 25 and a median of 20,what is the most likely value for the mean?
(Multiple Choice)
4.9/5 (29)
Which of the following statements is true for a distribution of scores?
(Multiple Choice)
4.8/5 (44)
A sample has n = 7 scores with a mean of M = 7.If one individual with a score of X = 1 is removed from the sample,the new mean will be M = 8.
(True/False)
4.8/5 (37)
A population of scores has a mean of µ = 26,a median of 23,and a mode of 22.What is the most likely shape for the population distribution?
(Multiple Choice)
4.8/5 (44)
A population of N = 7 scores has a mean of µ = 10.If one score with a value of X = 4 is removed from the population,what is the value for the new mean?
(Multiple Choice)
4.8/5 (38)
Adding a new score to a distribution will always change the value of the mean.
(True/False)
4.9/5 (31)
One item on a questionnaire asks students how many times in a typical week they eat at a fast-food restaurant.The responses for a sample of n = 10 students are summarized in the frequency distribution.What is the best measure of central tendency for these data??? 5 or more 2 4 3 3 2 2 1 1 1 0 1 ?
(Multiple Choice)
4.8/5 (31)
For a perfectly symmetrical distribution with a median of 30,what is the value of the mean?
(Multiple Choice)
4.9/5 (43)
A population has a mean of µ = 30.If 3 points are added to each score,what is the mean for the new distribution?
(Multiple Choice)
4.8/5 (30)
After every score in a sample is multiplied by 3,the mean is calculated and found to be M = 21.What was the mean for the original scores?
(Multiple Choice)
4.8/5 (32)
For a distribution with one or two extreme scores,the median is usually a more representative value than the mean.
(True/False)
4.8/5 (33)
The mean is considered to be the "balance point" for a distribution because exactly half of the scores are located above the mean and exactly half are below the mean.
(True/False)
4.7/5 (26)
For the scores in the following frequency distribution table,the mean is about M = 3.? 4 1 3 4 2 2
(True/False)
4.9/5 (39)
Filters
- Essay(0)
- Multiple Choice(0)
- Short Answer(0)
- True False(0)
- Matching(0)