Exam 2: Frequency Distributions
Exam 1: Introduction to Statistics76 Questions
Exam 2: Frequency Distributions74 Questions
Exam 3: Central Tendency75 Questions
Exam 4: Variability75 Questions
Exam 5: Z-Scores: Location of Scores and Standardized Distributions77 Questions
Exam 6: Probability76 Questions
Exam 7: Probability and Samples: the Distribution of Sample Means77 Questions
Exam 8: Introduction to Hypothesis Testing76 Questions
Exam 9: Introduction to the T Statistic74 Questions
Exam 10: The T Test for Two Independent Samples75 Questions
Exam 11: The T Test for Two Related Samples76 Questions
Exam 12: Introduction to Analysis of Variance74 Questions
Exam 13: Repeated-Measures Analysis of Variance Anova75 Questions
Exam 14: Two-Factor Analysis of Variance Independent Measures75 Questions
Exam 15: Correlation76 Questions
Exam 16: Introduction to Regression75 Questions
Exam 17: The Chi-Square Statistic: Tests for Goodness of Fit and Independence75 Questions
Exam 18: The Binomial Test75 Questions
Select questions type
A researcher records the number of traffic tickets issued in each county along the New York State thruway.If the results are presented in a frequency distribution graph,what kind of graph should be used?
Free
(Multiple Choice)
4.8/5  (28)
(28)
Correct Answer: Verified
A
If a set of exam scores forms a symmetrical distribution,what can we conclude about the students' scores?
Free
(Multiple Choice)
4.7/5 (33)
Correct Answer:Verified
C
For the distribution in the following table,the 90th percentile is X = 27.5.? \% 25-29 100\% 20-24 80\% 15-19 20\%
Free
(True/False)
4.9/5 (36)
Correct Answer:Verified
False
The students in a psychology class seemed to think that the midterm exam was very easy.If they are correct,what is the most likely shape for the distribution of exam scores?
(Multiple Choice)
4.9/5 (30)
In a grouped frequency distribution one interval is listed as 50-59.Assuming that the scores are measuring a continuous variable,what are the real limits of this interval?
(Multiple Choice)
4.8/5 (35)
A set of scores ranges from X = 18 to X= 91.If the scores are put in a grouped frequency distribution table with an interval width of 10 points,the top interval would be 91-100.
(True/False)
4.9/5 (39)
For the distribution in the following table,what is the 90th percentile?? X c\% 30-34 100\% 25-29 90\% 20-24 60\% 15-19 20\%
(Multiple Choice)
5.0/5 (34)
For the distribution in the following table,what is the 90th percentile? \% 9 100\% 8 80\% 7 50\% 6 25\%
(Multiple Choice)
4.9/5 (45)
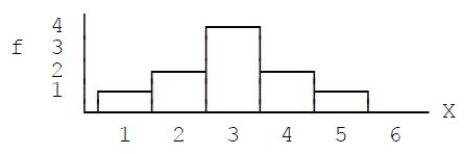 Figure 2.1
-What scale of measurement was used to measure the scores in the distribution shown in the accompanying graph,Figure 2.1?
Figure 2.1
-What scale of measurement was used to measure the scores in the distribution shown in the accompanying graph,Figure 2.1?
(Multiple Choice)
4.8/5 (30)
For the following distribution,how many people had scores greater than X = 14?? 20-25 2 15-19 5 10-14 4 5-9 1
(Multiple Choice)
4.8/5 (35)
For the distribution in the following table,what is the percentile rank for X = 8.5?? \% 9 100\% 8 80\% 7 50\% 6 25\%
(Multiple Choice)
4.8/5 (38)
It is customary to list the score categories in a frequency distribution from the highest down to the lowest.
(True/False)
4.8/5 (37)
In a grouped frequency distribution table,one interval is identified as 30-34.This interval has a width of 5 points.
(True/False)
4.9/5 (30)
Briefly explain what information is available in a regular frequency distribution table that is not available in a grouped table.
(Essay)
4.8/5 (34)
8 314 7 945 6 7042 5 68 4 14 Figure 2-3
-For the scores shown in the accompanying stem and leaf display,Figure 2-3,what is the highest score in the distribution??
(Multiple Choice)
4.8/5 (34)
A professor records the number of students who are absent each day for the semester.Because this is a numeric,discrete variable,a bar graph should be used to show the frequency distribution.
(True/False)
4.8/5 (26)
For the following scores:
a. Construct a frequency distribution table.
b. Sketch a histogram of the frequency distribution.6, 4, 3, 5, 4, 2, 45, 4, 6, 1, 4, 5, 2
(Essay)
4.7/5 (35)
What kind of frequency distribution graph shows the frequencies as bars,with no space between adjacent bars?
(Multiple Choice)
4.7/5 (36)
A stem and leaf display does not provide enough information to obtain a complete listing of the original set of scores.
(True/False)
4.8/5 (32)
For the following distribution,seven people have scores greater than X = 14.? 20-24 2 15-19 5 10-14 4 5-9 1
(True/False)
4.8/5 (31)
Filters
- Essay(0)
- Multiple Choice(0)
- Short Answer(0)
- True False(0)
- Matching(0)