Exam 10: Using the Competitive Model
Exam 1: An Introduction to Microeconomics95 Questions
Exam 2: Supply and Demand94 Questions
Exam 3: The Theory of Consumer Choice75 Questions
Exam 4: Individual and Market Demand100 Questions
Exam 5: Using Consumer Choice Theory85 Questions
Exam 6: Exchange, Efficiency, and Prices79 Questions
Exam 7: Production112 Questions
Exam 8: The Cost of Production121 Questions
Exam 9: Profit Maximization in Perfectly Competitive Markets97 Questions
Exam 10: Using the Competitive Model96 Questions
Exam 11: Monopoly112 Questions
Exam 12: Product Pricing With Monopoly Power89 Questions
Exam 13: Monopolistic Competition and Oligopoly98 Questions
Exam 14: Game Theory and the Economics of Information88 Questions
Exam 15: Using Noncompetitive Market Models78 Questions
Exam 16: Employment and Pricing of Inputs99 Questions
Exam 17: Wages, Rent, Interest, and Profit92 Questions
Exam 18: Using Input Market Analysis83 Questions
Exam 19: General Equilibrium Analysis and Economic Efficiency95 Questions
Exam 20: Public Goods and Externalities102 Questions
Select questions type
The following figure shows the effect of a price ceiling in the market for yams.The market was initially in equilibrium at price P2 and quantity B.
Figure 10-1 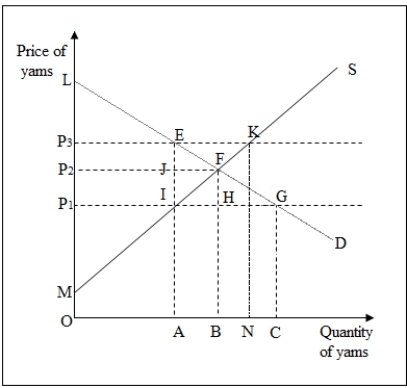 -In Figure 10-1,the aggregate consumer surplus after a price ceiling is set at P1 is _____.
(Multiple Choice)
4.8/5  (28)
(28)
The following figure shows the effect of a price ceiling in the market for yams.The market was initially in equilibrium at price P2 and quantity B.
Figure 10-1
-In Figure 10-1,what is the quantity of output produced after the imposition of the price ceiling at P1?
(Multiple Choice)
4.9/5 (35)
The following figure shows the demand and supply for a commodity in the domestic U.S.market as well as the global market.The commodity is imported from the rest of the world to the U.S.market.
Figure 10-3  -Refer to Figure 10-3.The total consumer surplus prior to trade was _____.
(Multiple Choice)
4.8/5 (42)
Consider two increasing cost competitive industries (A and B)having identical demand curves.However,the supply curve faced by industry A is more inelastic than the supply curve of industry B.Which of the following is true if a per-unit excise tax is levied on the output of both the industries?
(Multiple Choice)
4.7/5 (31)
Suppose the government limits the number of cabs that can operate in the city by issuing a limited number of medallions.Later,if the government decides to regulate fares instead and sets them below current levels:
(Multiple Choice)
4.8/5 (39)
The following figure shows the intersection of demand and supply at the price P2 and quantity Q2 in a competitive market.
Figure 10-2 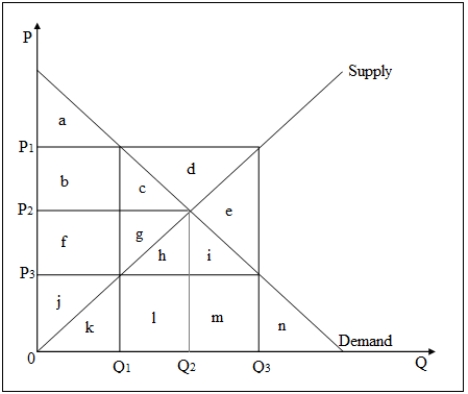 -Refer to Figure 10-2.What is the producer surplus at the equilibrium level of output?
(Multiple Choice)
4.7/5 (36)
The Candlemakers' petition was a satire of protectionism written and published in 1845.In the petition,candlemakers advocated that all businesses should shut their blinds and curtains and block all sunlight from entering their buildings.Although satirical,which of the following would be expected to take place if this policy were implemented?
(Multiple Choice)
4.8/5 (38)
The following figure shows the effect of a price ceiling in the market for yams.The market was initially in equilibrium at price P2 and quantity B.
Figure 10-1  -Refer to Figure 10-1.The change in aggregate consumer surplus due to a price ceiling set at P1 is area _____.
(Multiple Choice)
4.8/5 (39)
Restrictions on entry in the taxicab market tends to benefit _____ the most.
(Multiple Choice)
4.9/5 (36)
Presently,the United States produces as well as imports crude oil.Suppose the government imposes a $10 per barrel excise tax on imported oil.What will happen?
(Multiple Choice)
4.8/5 (29)
When the U.S.airline industry was regulated by the Civil Aeronautics Board (CAB),airline workers' unions:
(Multiple Choice)
4.8/5 (41)
Deregulation of the taxicab industry is most likely to result in:
(Multiple Choice)
4.9/5 (39)
Which of the following is true of a quota in a competitive market?
(Multiple Choice)
4.7/5 (34)
The following figure shows the demand and supply for a commodity in the domestic U.S.market as well as the global market.The commodity is imported from the rest of the world to the U.S.market.
Figure 10-3
-In Figure 10-3,the net gain to the U.S.from trade is _____.
(Multiple Choice)
4.9/5 (41)
The following figure shows the demand and supply for a commodity in the domestic U.S.market as well as the global market.The commodity is imported from the rest of the world to the U.S.market.
Figure 10-3 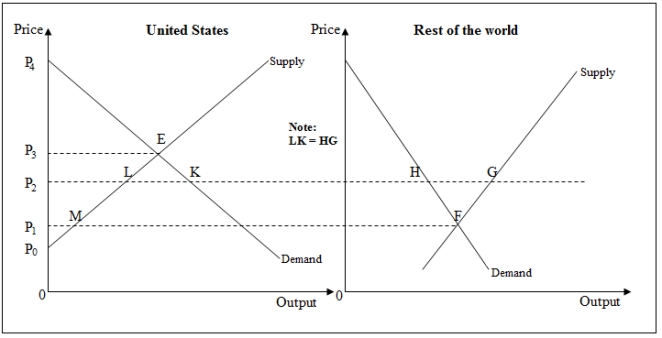 -Refer to Figure 10-3.In the absence of trade,the equilibrium price in the U.S.market is _____.
(Multiple Choice)
4.8/5 (31)
Filters
- Essay(0)
- Multiple Choice(0)
- Short Answer(0)
- True False(0)
- Matching(0)