Exam 14: The Demand and Supply of Resources
Exam 1: Five Foundations of Economics175 Questions
Exam 2: Model Building and Gains From Trade175 Questions
Exam 3: The Market at Work: Supply and Demand175 Questions
Exam 4: Elasticity175 Questions
Exam 5: Market Outcomes and Tax Incidence175 Questions
Exam 6: Price Controls173 Questions
Exam 7: Market Inefficiencies: Externalities and Public Goods172 Questions
Exam 8: Business Costs and Production175 Questions
Exam 9: Firms in a Competitive Market174 Questions
Exam 10: Understanding Monopoly176 Questions
Exam 11: Price Discrimination175 Questions
Exam 12: Monopolistic Competition and Advertising173 Questions
Exam 13: Oligopoly and Strategic Behavior175 Questions
Exam 14: The Demand and Supply of Resources172 Questions
Exam 15: Income,inequality,and Poverty183 Questions
Exam 16: Consumer Choice173 Questions
Exam 17: Behavioral Economics and Risk Taking168 Questions
Exam 18: Health Insurance and Health Care172 Questions
Exam 19: International Trade167 Questions
Select questions type
Assume that consumer demand for hybrid vehicles is increasing and that for large SUVs it is decreasing.The labor supply is the same for both markets.
a.How does this difference in consumer demand affect the labor demand for workers producing hybrid vehicles versus that of workers making SUVs?
b.Using a supply and demand graph and your answer to part a,show why workers producing hybrids earn more than workers who build SUVs.
(Essay)
4.8/5  (34)
(34)
If the price of pencils falls,the marginal product of labor will ________ and the value of the marginal product of labor will ________.
(Multiple Choice)
4.9/5 (35)
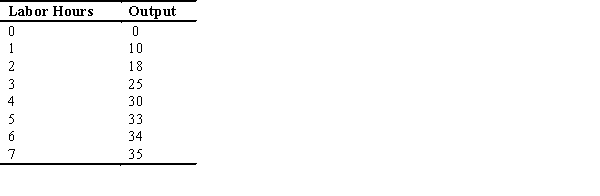
Refer to the following figure to answer the following questions:
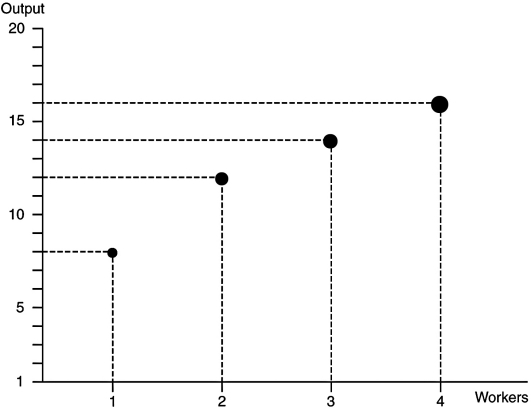 -What is the marginal product of the third worker?
(Multiple Choice)
4.9/5 (36)
The area underneath a firm's labor demand curve and above the market wage is the graphical representation of the firm's
(Multiple Choice)
4.9/5 (44)
As computer usage in companies and in the home has increased,the labor demand for information technology (IT)workers has
(Multiple Choice)
4.9/5 (35)
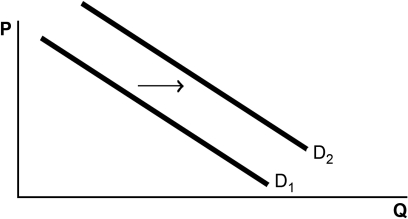
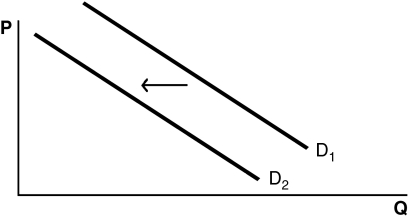
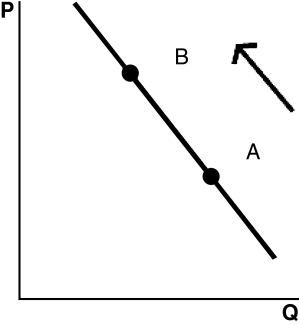
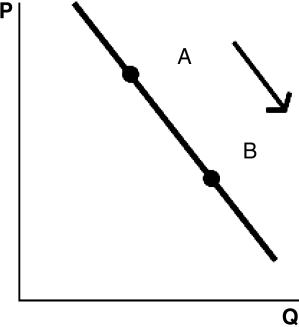
Refer to the following graphs to answer the following questions:
A.
 B.
B.
 C.
C.
 D.
D.
 E.
E.
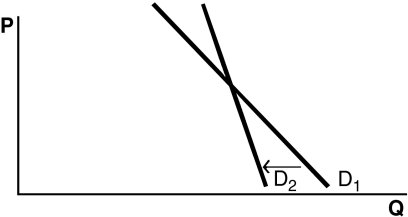 -Choose the graph that represents the following situation: A documentary on bottled water demonstrates the high impact this product has on the environment.In response,consumers drastically reduce their consumption of this product.
(Multiple Choice)
4.7/5 (34)
The worker productivity of Cutie Cupcakes is presented in the following table.Use the table to answer the following questions:
 -When Cutie Cupcakes hires its three hundredth worker,what is that worker's marginal product of labor?
(Multiple Choice)
4.8/5 (40)
Ummal travels back in time to deposit $100 in a high-interest-bearing savings account.When she returns to the present,she is a billionaire.We can expect Ummal to work ________ hours because of the ________ effect.
(Multiple Choice)
4.8/5 (39)
The government lowers the retirement age to 55.We would expect to see the labor supply curve
(Multiple Choice)
4.9/5 (34)
One of the primary causes of diminishing marginal product is
(Multiple Choice)
4.7/5 (39)
Use the following table to answer the following questions:
 -If the workers are paid $8 per hour,the price of the product is $4,and the fixed cost of the business is $20,then how many workers should the business employ?
(Multiple Choice)
4.9/5 (41)
It is profitable for Jack's Jingles to use more equipment in the production of its songs when the
(Multiple Choice)
5.0/5 (42)
When Noah's wage rises and he decides to work more hours,we know that the ________ effect has dominated the ________ effect.
(Multiple Choice)
4.9/5 (34)
Use the following table to answer the following questions:
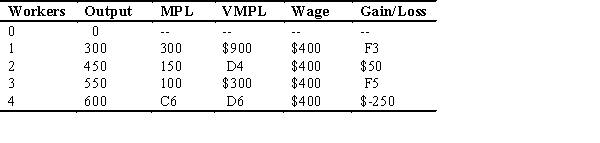 -What is the value that belongs in cell F5?
(Multiple Choice)
4.9/5 (31)
Refer to the following graphs to answer the following questions:
A.
B.
C.
D.
E.
-Choose the graph that represents the following situation: The government raises the minimum wage.
(Multiple Choice)
4.8/5 (41)
Lorelei finds that she is consistently unable to fill all of the open positions at her bakery.This indicates that the wage she is offering is
(Multiple Choice)
4.9/5 (36)
The fact that workers must share a limited amount of space and equipment results in ________ marginal productivity.
(Multiple Choice)
4.8/5 (37)
Filters
- Essay(0)
- Multiple Choice(0)
- Short Answer(0)
- True False(0)
- Matching(0)