Exam 14: The Demand and Supply of Resources
Exam 1: Five Foundations of Economics175 Questions
Exam 2: Model Building and Gains From Trade175 Questions
Exam 3: The Market at Work: Supply and Demand175 Questions
Exam 4: Elasticity175 Questions
Exam 5: Market Outcomes and Tax Incidence175 Questions
Exam 6: Price Controls173 Questions
Exam 7: Market Inefficiencies: Externalities and Public Goods172 Questions
Exam 8: Business Costs and Production175 Questions
Exam 9: Firms in a Competitive Market174 Questions
Exam 10: Understanding Monopoly176 Questions
Exam 11: Price Discrimination175 Questions
Exam 12: Monopolistic Competition and Advertising173 Questions
Exam 13: Oligopoly and Strategic Behavior175 Questions
Exam 14: The Demand and Supply of Resources172 Questions
Exam 15: Income,inequality,and Poverty183 Questions
Exam 16: Consumer Choice173 Questions
Exam 17: Behavioral Economics and Risk Taking168 Questions
Exam 18: Health Insurance and Health Care172 Questions
Exam 19: International Trade167 Questions
Select questions type
The following graph represents Zendar's labor market.Use this graph to answer the following questions:
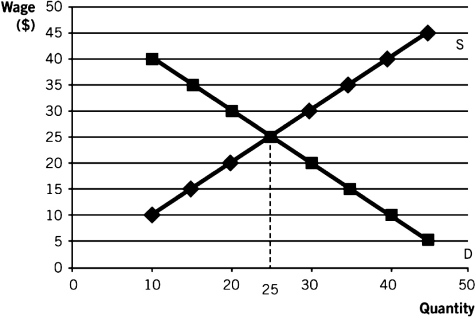 -At all wages below ________,there will be ________.
(Multiple Choice)
4.8/5  (41)
(41)
You know that the rental price of capital is $3,000,the rental price of land is $2,000,and the wage of labor is $100.The value of the marginal product produced by each factor is $30,000,$4,000,and $200,respectively.You would advise the company to hire more
(Multiple Choice)
4.8/5 (33)
Use the following graph,which depicts Mighty Max's labor demand for his duffel bag business,to answer the following questions.The labor demand curve shown is calculated based on a duffel bag price of $10.
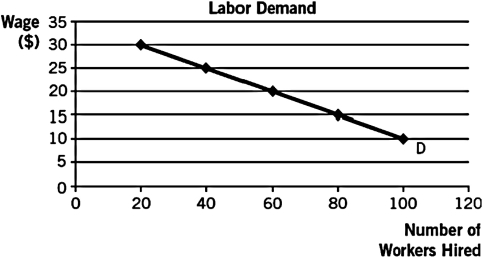 -If the wage is $20,Mighty Max will hire __________ workers.
(Multiple Choice)
4.7/5 (41)
Lakeside Tubing knows that its total product schedule is as shown in the following table.It currently rents an inner tube for $5.Graph the labor demand curve.

(Essay)
4.9/5 (32)
Kaitlin has recently been trained as a highly specialized medical physician.There is only one hospital that needs her services.Kaitlin can expect her wages to be ________ compared to what her wages would be in a situation of perfect competition.
(Multiple Choice)
4.9/5 (41)
Refer to the following graphs to answer the following questions:
A. 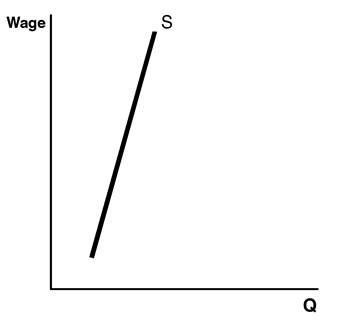 B.11efbc7a_aae2_b1ce_a154_5b2bc6d63cd5_TB4871_00
C.
B.11efbc7a_aae2_b1ce_a154_5b2bc6d63cd5_TB4871_00
C. 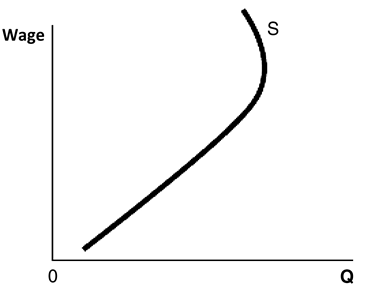 D.
D.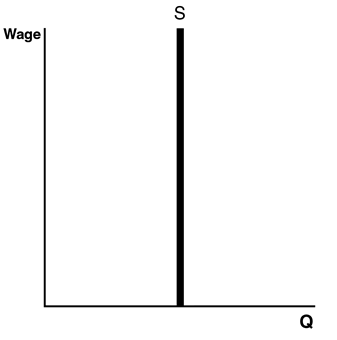 E.
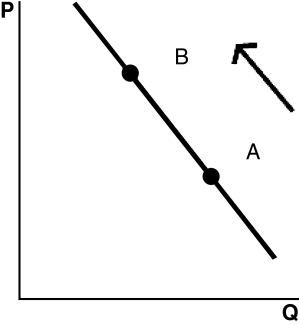
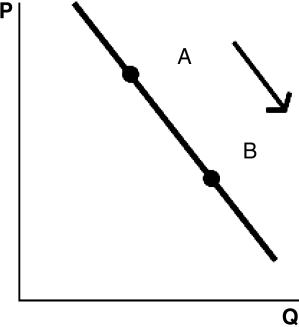
E.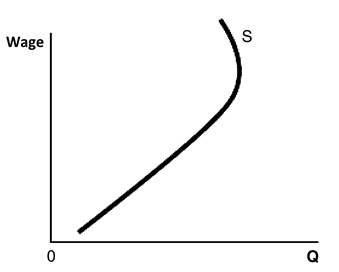 -Which graph shows the income effect dominating the substitution effect of higher wages?
(Multiple Choice)
4.8/5 (40)
Refer to the following graphs to answer the following questions:
A.
 B.
B.
 C.
C.
 D.
D.
 E.
E.
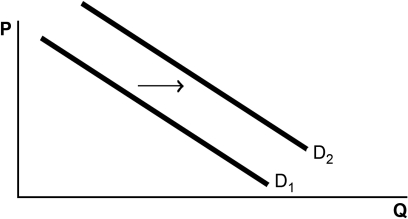
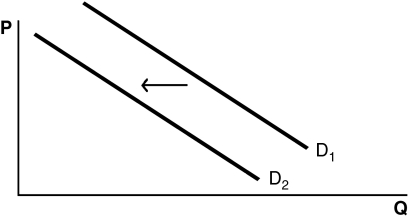
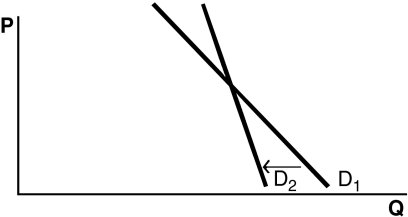 -Choose the graph that represents the following situation: Consumer demand for Princeton Pickles increases as customers find out that pickles are highly nutritious.
(Multiple Choice)
4.9/5 (34)
Suppose that a profit-maximizing firm in a competitive market hires labor up to the point at which the value of the marginal product equals the wage and that labor is the only variable input.The price of the product is $150 per unit.If the firm pays a wage of $700 per week and the marginal product of labor equals 20 units per week,then the marginal cost of producing an additional unit of output is
(Multiple Choice)
4.8/5 (32)
After World War II,social norms relating to women's participation in the labor force relaxed and women were more likely to be employed outside the home.We would expect to see the labor supply curve
(Multiple Choice)
4.9/5 (33)
If more of the production process for automobiles were switched over to machines,the demand for auto factory assembly line workers would ________ machine maintenance.
(Multiple Choice)
4.8/5 (37)
Filters
- Essay(0)
- Multiple Choice(0)
- Short Answer(0)
- True False(0)
- Matching(0)