Exam 17: Market Failure: Externalities, public Goods, and Asymmetric Information
Exam 1: What Economics Is About174 Questions
Exam 2: Production Possibilities Frontier Framework156 Questions
Exam 3: Supply and Demand: Theory224 Questions
Exam 4: Prices: Free,controlled,and Relative122 Questions
Exam 5: Supply,demand,and Price: Applications64 Questions
Exam 6: Elasticity151 Questions
Exam 7: Consumer Choice: Maximizing Utility and Behavioral Economics147 Questions
Exam 8: Production and Costs204 Questions
Exam 9: Perfect Competition172 Questions
Exam 10: Monopoly200 Questions
Exam 11: Monopolistic Competition, oligopoly, and Game Theory167 Questions
Exam 12: Government and Product Markets: Antitrust and Regulation150 Questions
Exam 13: Factor Markets: With Emphasis on the Labor Market180 Questions
Exam 14: Wages,union,and Labor150 Questions
Exam 15: The Distribution of Income and Poverty185 Questions
Exam 16: Interest,rent,and Profit150 Questions
Exam 17: Market Failure: Externalities, public Goods, and Asymmetric Information103 Questions
Exam 18: Public Choice and Special-Interest-Group Politics100 Questions
Exam 19: Building Theories to Explain Everyday Life: From Observations to Questions to Theories to Predictions128 Questions
Exam 20: International Trade61 Questions
Exam 21: International Finance153 Questions
Exam 22: The Economic Case for and Against Government: Five Topics Considered121 Questions
Exam 23: Stocks,bonds,futures,and Options82 Questions
Exam 24: Stocks,bonds,futures,and Options110 Questions
Select questions type
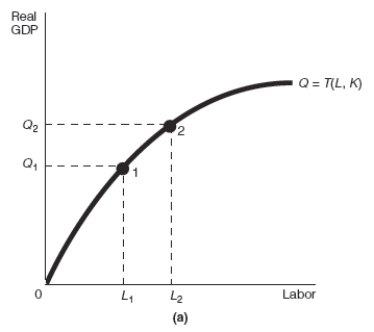
Using the production function Real GDP = T (L,K),define the term production function and describe what each of the variables (T,L,and K)represents.When graphed with Real GDP on the vertical axis and labor on the horizontal axis,which variable(s)can shift the production function and which variable(s)can cause a movement along the production function?
(Essay)
4.8/5  (37)
(37)
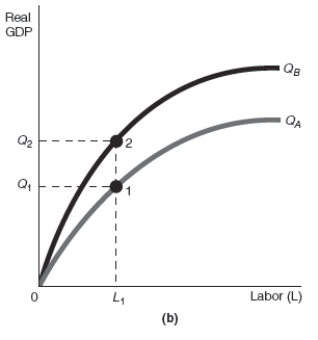 -Refer to Exhibit 17-2.Assume that the starting point is always point 1.Which of the production function graphs shown,(a)or (b),represents an increase in the quantity of labor,and which represents an increase in the quantity of capital,respectively?
(Multiple Choice)
4.8/5 (36)
Production functions used in economic growth theory are always limited to two inputs: labor and capital.
(True/False)
4.9/5 (28)
Lower interest rates cause a(n)____________in capital utilization,which shifts the production function __________and thereby shifts the LRAS curve ______________.
(Multiple Choice)
4.9/5 (29)
Applying the concept of a production function to your learning,assume that the amount of learning you acquire can be summarized by the following equation (and that your motivation to learn and the quality of instruction are both rated on a scale from 1 to 10):
Amount of learning acquired = 0.2(number of books read)+ 0.25(hours spent studying)+ 0.15(quality of instruction)+ 0.4(motivation to learn)
-Refer to Exhibit 17-5.Based on the equation given in this exhibit,if you read 2 books,study for 3 hours,have an instructor whose quality of instruction is ranked as 4,and your motivation to learn is ranked as 7,what is the amount of learning that you will acquire?
(Multiple Choice)
4.9/5 (36)
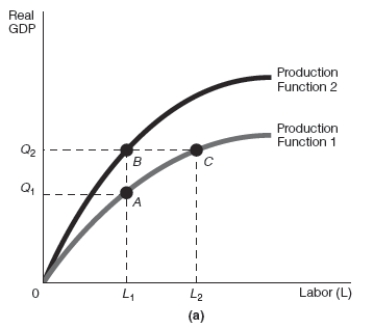
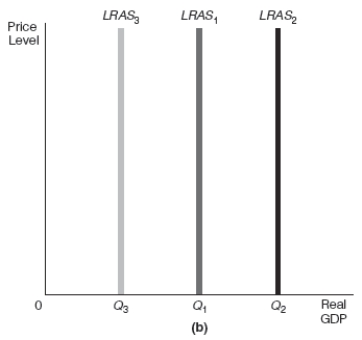 -Refer to Exhibit 17-3 Assume that the starting point on the production function is point A.After an increase in the technology coefficient,there would be a ______________________ which would shift the LRAS curve from LRAS1 to _______________ resulting in _______________..
(Multiple Choice)
4.7/5 (33)
Using the production function Real GDP = T (L,K),define the term production function and describe what each of the variables (T,L,and K)represents.When graphed with Real GDP on the vertical axis and labor on the horizontal axis,which variable(s)can shift the production function and which variable(s)can cause a movement along the production function?
(Essay)
4.8/5 (33)
Using the production function Real GDP = T (L,K),and the LRAS curve,describe the process by which a decline in interest rates impacts the use of capital and economic growth.
(Essay)
4.9/5 (40)
When taxes on the return to capital in a given economy are reduced,it causes firms to employ __________ capital goods.In terms of the production function (graphed with labor on the horizontal axis and Real GDP on the vertical axis),this then causes ____________________ which makes the LRAS curve shift ____________ resulting in ______________________.
(Multiple Choice)
4.7/5 (33)
When income taxes are lowered in a given economy,it causes the supply of labor curve to shift __________which ___________ the equilibrium quantity of labor employed.In terms of the production function (graphed with labor on the horizontal axis and Real GDP on the vertical axis)this then causes _______________,which makes the LRAS curve shift ____________ resulting in ______________________.
(Multiple Choice)
4.8/5 (47)
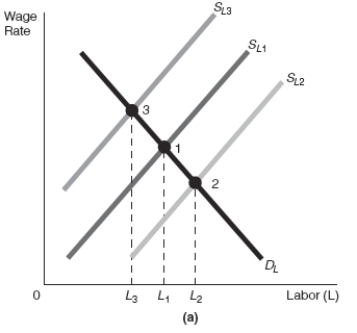
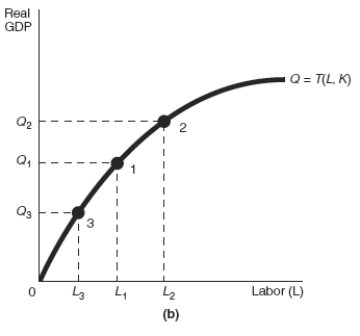
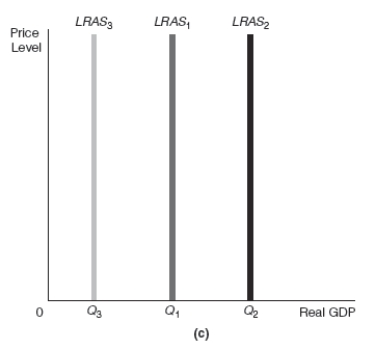 -Refer to Exhibit 17-4 Assume that the starting point in graphs (a)and (b)in Exhibit 17-4 is point 1.After a decrease in income taxes,there would be a ______________________ which would cause a movement along the production function from point 1 to point ______________.The result would be a shift of the LRAS curve from LRAS1 to _______________ resulting in _______________..
(Multiple Choice)
4.8/5 (39)
Technology is defined as "the humanly devised constraints that shape human interaction."
(True/False)
4.9/5 (30)
Production Function
Real GDP = T (L,K),such that Real GDP = T(L + K)
Assume that the technology coefficient is equal to 0.40.
-Refer to Exhibit 17-1.If this production function is graphed with Real GDP on the vertical axis and labor on the horizontal axis,and labor rises from 6 units to 7 units it would cause a
(Multiple Choice)
4.8/5 (31)
In contrast to neoclassical growth theory,new growth theory lays more emphasis on
(Multiple Choice)
4.9/5 (39)
In the production function Real GDP = T (L,K),the T represents the tax coefficient.
(True/False)
4.7/5 (30)
The relation between technology and the quantity of factor inputs to Real GDP is specified by the production function.
(True/False)
4.9/5 (43)
-Refer to Exhibit 17-2.Assume that the starting point is always point 1.Which of the production function graphs shown,(a)or (b),represents an increase in the quantity of labor,and which represents an increase in the technology coefficient,respectively?
(Multiple Choice)
4.8/5 (37)
An economy growing at a steady rate of 1.8 percent per year doubles in size approximately every __________ years.
(Multiple Choice)
4.8/5 (36)
In the production function Real GDP = T (L,K,NR,H),the T represents the _____________ coefficient,the L represents ________________,the K represents _______________,the NR represents natural resources,and the H represents ________________.
(Multiple Choice)
4.8/5 (40)
Examples of physical capital include _______________________.Examples of human capital include ______________________________.
(Multiple Choice)
4.8/5 (41)
Filters
- Essay(0)
- Multiple Choice(0)
- Short Answer(0)
- True False(0)
- Matching(0)