Exam 6: Cost Behavior
Exam 1: Introduction to Managerial Accounting201 Questions
Exam 2: Building Blocks of Managerial Accounting318 Questions
Exam 3: Job Costing333 Questions
Exam 4: Activity-Based Costing, Lean Operations, and the Costs of Quality262 Questions
Exam 5: Process Costing271 Questions
Exam 6: Cost Behavior307 Questions
Exam 7: Cost-Volume-Profit Analysis276 Questions
Exam 8: Relevant Costs for Short-Term Decisions270 Questions
Exam 9: The Master Budget219 Questions
Exam 10: Performance Evalulation232 Questions
Exam 11: Standard Costs and Variances254 Questions
Exam 12: Capital Investment Decisions and the Time Value of Money213 Questions
Exam 13: Statement of Cash Flows193 Questions
Exam 14: Financial Statement Analysis196 Questions
Exam 15: Sustainability123 Questions
Select questions type
If a scatterplot reveals a fairly weak relationship between cost and volume, the manager should select a different activity for modeling cost behavior.
(True/False)
4.7/5  (29)
(29)
When performing account analysis, managers decide how to classify each account as a variable, fixed or mixed cost.
(True/False)
4.8/5 (36)
Relevant range is the range of activity (volume)over which total fixed costs and variable costs per unit can be assumed to remain the same.
(True/False)
4.9/5 (36)
What variable represents the volume of activity in the equation: y = vx + f? (Assume v represents the variable cost per unit of activity.)
(Multiple Choice)
4.7/5 (40)
Your client's company wants to determine the relationship between its monthly operating costs and a potential cost driver. The output of regression analysis showed the following information: Intercept Coefficient = 89,500
X Variable 1 Coefficient = 62.50
R-square = 0.9855
What is the company's monthly cost equation?
(Multiple Choice)
4.8/5 (35)
Using account analysis, what type of cost is the local phone service which charges a flat fee for unlimited local calls?
(Multiple Choice)
4.9/5 (37)
The Heartlake Corporation manufactures and sells toy gyroscopes. The following data is related to sales and production of the toy gyroscopes for last year. 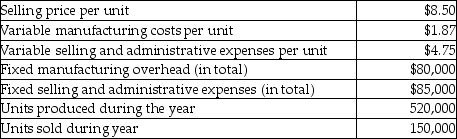 Using variable costing, what is the operating income for last year?
(Multiple Choice)
4.9/5 (34)
The Heartlake Corporation manufactures and sells toy gyroscopes. The following data is related to sales and production of the toy gyroscopes for last year.  Using absorption costing, what is gross profit for last month? (Round any intermediary calculations to the nearest cent.)
(Multiple Choice)
4.9/5 (37)
The R-squared statistic determined by regression analysis is sometimes referred to as the "goodness-of-fit" statistic.
(True/False)
4.8/5 (36)
The fixed cost per unit of activity varies with changes in volume.
(True/False)
4.9/5 (37)
How is operating income affected if the number of units sold exceeds the number of units produced?
(Multiple Choice)
4.9/5 (35)
If the data points in a scatter plot fall in a fairly straight line, it means that there is a fairly strong relationship between cost and volume.
(True/False)
4.7/5 (43)
Best Birdies produces ornate birdcages. The company's average cost per unit is $23 when it produces 2600 birdcages. If $5900 of the total costs are fixed, what is the variable cost of producing each birdcage?
(Multiple Choice)
4.7/5 (42)
When graphing total fixed costs, the fixed cost per unit is the slope of the fixed cost line.
(True/False)
4.9/5 (47)
When using the high-low method, what is the correct order of the following three steps? i. write the cost equation
Ii) find the vertical intercept
Iii) find the slope
(Multiple Choice)
4.8/5 (46)
Managers whose bonuses are based on operating income have more incentive to increase inventory levels when variable costing is used than when absorption costing is used.
(True/False)
4.9/5 (45)
Sea Side Enterprises is trying to predict the cost associated with producing its anchors. At a production level of 5100 anchors, Sea Side Enterprises' average cost per anchor is $53 If $17,000 of the total costs are fixed, what is the variable cost of producing each anchor?
(Multiple Choice)
4.8/5 (37)
The income statement is organized by ________ under absorption costing.
(Multiple Choice)
4.9/5 (44)
The line determined by regression analysis is sometimes referred to as the "line of worst fit."
(True/False)
4.8/5 (35)
Filters
- Essay(0)
- Multiple Choice(0)
- Short Answer(0)
- True False(0)
- Matching(0)