Exam 15: Externalities , Environmental Policy and Public Goods
Exam 1: Economics Foundations and Models160 Questions
Exam 2: Choices and Trade - Offs in the Market192 Questions
Exam 3: Where Prices Come Frome : The Interaction of Demand and Supply202 Questions
Exam 4: Elasticity: The Responsiveness of Demand and Supply226 Questions
Exam 5: Economic Efficiency , Government Price Setting and Taxes187 Questions
Exam 6: Concumer Choice and Behavioural Economics254 Questions
Exam 7: Technology , Production and Costs300 Questions
Exam 8: Firms in Perfectly Compitive Markets270 Questions
Exam 9: Monopoly Markets281 Questions
Exam 10: Monopolistic Competition : The Competitive Model in More Realistic Setting255 Questions
Exam 11: Oligopoly : Firms in Less Competitve Markets186 Questions
Exam 12: The Market for Labour and Other Factors of Production253 Questions
Exam 13: International Trade111 Questions
Exam 14: Government Intervention in the Market122 Questions
Exam 15: Externalities , Environmental Policy and Public Goods212 Questions
Exam 16: The Distribution of Income and Social Policy120 Questions
Select questions type
 -Refer to Figure 15-9. Let's suppose the government imposes a tax of $50 per ton of toilet paper to bring about the efficient level of production. What happens to the market price of toilet paper?
(Multiple Choice)
4.8/5  (40)
(40)
Haiti was once a heavily forested country. Today, 80 per cent of Haiti's forests have been cut down, primarily to be burned to create charcoal. The reduction in the number of trees has led to devastating floods when it rains heavily. This is an example of
(Multiple Choice)
4.8/5 (38)
An external benefit is created when you pursue a university education.
(True/False)
5.0/5 (34)
If you burn your trash in the back yard in spite of regulations against it, then you are
(Multiple Choice)
4.9/5 (36)
 -Refer to Figure 15-6. What is the economically efficient output level?
(Multiple Choice)
4.9/5 (36)
Which of the following is an example of a quasi-public good?
(Multiple Choice)
4.8/5 (35)
 -Refer to Figure 15-14. Identify the area that shows the deadweight loss from overfishing.
(Multiple Choice)
4.9/5 (42)
A quasi-public good differs from a public good in that unlike a public good, it is possible to keep out those who do not pay for the quasi-public good from enjoying the benefits of the good.
(True/False)
4.8/5 (46)
The social cost of cutting trees for firewood in a government forest is
(Multiple Choice)
4.8/5 (44)
 -Refer to Figure 15-3. The deadweight loss due to the externality is represented by the area
(Multiple Choice)
4.9/5 (39)
In economics, the optimal level of pollution is the level for which the net benefit from reducing the pollution is the greatest.
(True/False)
4.9/5 (45)
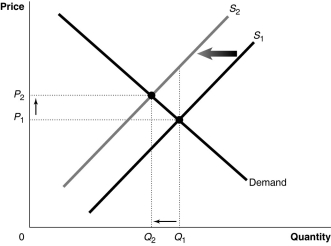 -Refer to Figure 15-1. If, because of an externality, the economically efficient output is Q2 and not the current equilibrium output of Q1, what does S2 represent?
(Multiple Choice)
4.8/5 (32)
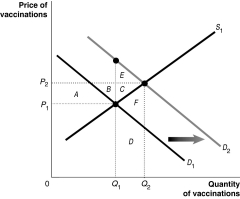
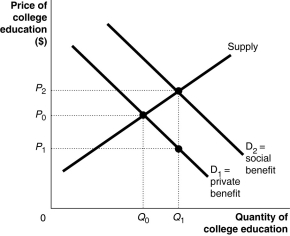 -Refer to Figure 15-12. One way to obtain the economically efficient amount of university education is for governments to subsidise university education. What is the size of the per-student Pigovian subsidy that the government must provide to internalise the external benefits? (Note that the subsidy can be granted to the education institutions or to the students directly or indirectly; for example, through low-interest student loans.)
(Multiple Choice)
4.8/5 (37)
How does the construction of a market demand curve for a private good differ from that for a public good?
(Multiple Choice)
4.9/5 (31)
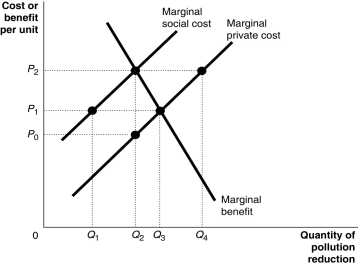
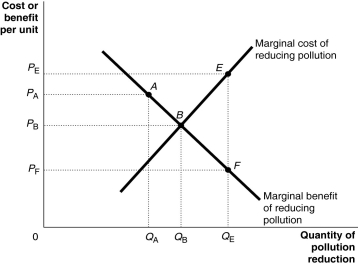 -Refer to Figure 15-7. What is the incremental cost of increasing the quantity of pollution reduction from QB to QE units?
(Multiple Choice)
4.9/5 (31)
Filters
- Essay(0)
- Multiple Choice(0)
- Short Answer(0)
- True False(0)
- Matching(0)