Exam 19: General Equilibrium Analysis and Economic Efficiency
Exam 1: An Introduction to Microeconomics72 Questions
Exam 2: Supply and Demand97 Questions
Exam 3: The Theory of Consumer Choice97 Questions
Exam 4: Individual and Market Demand99 Questions
Exam 5: Using Consumer Choice Theory75 Questions
Exam 6: Exchange, Efficiency, and Prices82 Questions
Exam 7: Production112 Questions
Exam 8: The Cost of Production121 Questions
Exam 9: Profit Maximization in Perfectly Competitive Markets99 Questions
Exam 10: Using the Competitive Model82 Questions
Exam 11: Monopoly115 Questions
Exam 12: Product Pricing With Monopoly Power88 Questions
Exam 13: Monopolistic Competition and Oligopoly98 Questions
Exam 14: Game Theory and the Economics of Information88 Questions
Exam 15: Using Noncompetitive Market Models77 Questions
Exam 16: Employment and Pricing of Inputs100 Questions
Exam 17: Wages, Rent, Interest, and Profit92 Questions
Exam 18: Using Input Market Analysis83 Questions
Exam 19: General Equilibrium Analysis and Economic Efficiency93 Questions
Exam 20: Public Goods and Externalities101 Questions
Select questions type
General equilibrium analysis is more appropriate than partial equilibrium analysis when:
Free
(Multiple Choice)
4.8/5  (38)
(38)
Correct Answer: Verified
C
Use the following figure to answer the question : Figure 19-1 :
,the curve TT shows how the allocation of a resource affects the well-being of two individuals,Hank and Monica. 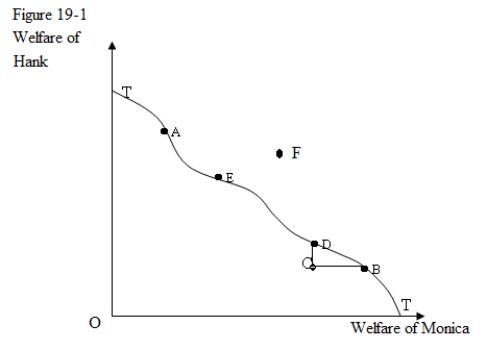 -Refer to Figure 19-1.Which of the following would represent a movement from an inefficient allocation of resources to an efficient allocation of resources?
Free
(Multiple Choice)
4.8/5 (39)
Correct Answer:Verified
B
Partial equilibrium analysis tends to ignore:
Free
(Multiple Choice)
4.8/5 (30)
Correct Answer:Verified
C
Explain why economic efficiency cannot be achieved under certain circumstances.
(Essay)
4.9/5 (32)
Use the following figure to answer the question : Figure 19-1 :
,the curve TT shows how the allocation of a resource affects the well-being of two individuals,Hank and Monica.
-In Figure 19-1,a movement from A to B would represent:
(Multiple Choice)
4.8/5 (33)
A perfectly competitive economy generally results in an efficient distribution of products among consumers.This because competitive markets:
(Multiple Choice)
4.9/5 (34)
If there is a monopoly in the capital market,whereas the labor market is competitive then:
(Multiple Choice)
4.8/5 (29)
Use the following figure to answer the question : Figure 19-1 :
,the curve TT shows how the allocation of a resource affects the well-being of two individuals,Hank and Monica.
-In Figure 19-1,point F represents a resource allocation that is:
(Multiple Choice)
4.8/5 (25)
Figure 19-3 illustrates the determination of an efficient output mix in a two good economy.The output combination is represented by point Z and the consumption point of a representative consumer is W.The slope of the line zz represents the marginal rate of transformation [MRT]. ![Figure 19-3 illustrates the determination of an efficient output mix in a two good economy.The output combination is represented by point Z and the consumption point of a representative consumer is W.The slope of the line zz represents the marginal rate of transformation [MRT]. Refer to Figure 19-3.Based on the information given in the figure,we can conclude that:](https://storage.examlex.com/TB1826/11ea857e_d7e7_d701_a433_a1ee3cb3e769_TB1826_00_TB1826_00.jpg) Refer to Figure 19-3.Based on the information given in the figure,we can conclude that:
Refer to Figure 19-3.Based on the information given in the figure,we can conclude that:
(Multiple Choice)
4.8/5 (32)
Which of the following is not one of the three fundamental economic problems facing an economy?
(Multiple Choice)
4.8/5 (47)
Use the following figure to answer the question : Figure 19-1 :
,the curve TT shows how the allocation of a resource affects the well-being of two individuals,Hank and Monica.
-In Figure 19-1,the curve TT shows:
(Multiple Choice)
4.8/5 (35)
Two goods are said to be allocated efficiently between consumers when:
(Multiple Choice)
4.7/5 (33)
In which of the following situations would it be most important to use the general equilibrium analysis?
(Multiple Choice)
4.8/5 (37)
The marginal rate of transformation between wine and corn refers to:
(Multiple Choice)
4.9/5 (45)
Which of the following is true of the general equilibrium analysis?
a.It assumes that a change initiated in a market does not affect prices in other markets.
b.It determines changes in equilibrium price in a market assuming that all other markets are in equilibrium.
c.The ceteris paribus assumption is crucial in determining changes in price and quantity in general equilibrium analysis.
d.It is useful in determining price and quantity of goods and services when the markets mutually interdependent.
(Essay)
4.8/5 (33)
Answer the following:
a)Discuss the importance of information in achieving economic efficiency.
b)How is information available in the real world?
c)What role does the market play in making relevant information available?
(Essay)
4.8/5 (27)
Which of the following assumptions are made in a partial equilibrium analysis?
(Multiple Choice)
4.9/5 (32)
Markets fail to satisfy the conditions of Pareto optimality when:
(Multiple Choice)
5.0/5 (22)
If the marginal rate of substitution between two goods is not equal for Jack and Jill it means that:
(Multiple Choice)
4.8/5 (44)
Filters
- Essay(0)
- Multiple Choice(0)
- Short Answer(0)
- True False(0)
- Matching(0)