Exam 13: Aggregate Demand and Aggregate Supply Analysis
Exam 1: Economics: Foundations and Models211 Questions
Exam 2: Trade-Offs,comparative Advantage,and the Market System239 Questions
Exam 3: Where Prices Come From: the Interaction of Demand and Supply233 Questions
Exam 4: Economic Efficiency, government Price Setting, and Taxes211 Questions
Exam 5: The Economics of Health Care164 Questions
Exam 6: Firms,the Stock Market,and Corporate Governance276 Questions
Exam 7: Comparative Advantage and the Gains From International Trade190 Questions
Exam 8: GDP: Measuring Total Production and Income266 Questions
Exam 9: Unemployment and Inflation292 Questions
Exam 10: Economic Growth, the Financial System, and Business Cycles257 Questions
Exam 11: Long-Run Economic Growth: Sources and Policies268 Questions
Exam 12: Aggregate Expenditure and Output in the Short Run306 Questions
Exam 13: Aggregate Demand and Aggregate Supply Analysis284 Questions
Exam 14: Money, banks, and the Federal Reserve System280 Questions
Exam 15: Monetary Policy277 Questions
Exam 16: Fiscal Policy303 Questions
Exam 17: Inflation, unemployment, and Federal Reserve Policy257 Questions
Exam 18: Macroeconomics in an Open Economy278 Questions
Exam 19: The International Financial System262 Questions
Select questions type
Starting from long-run equilibrium,use the basic aggregate demand and aggregate supply diagram to show what happens in both the long run and the short run when there is a decline in wealth.
(Essay)
4.8/5  (31)
(31)
Figure 13-3 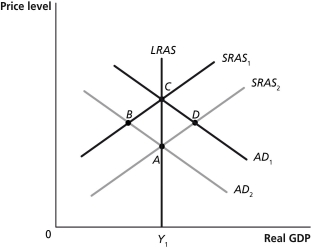 -Refer to Figure 13-3.Which of the points in the above graph are possible short-run equilibria but not long-run equilibria? Assume that Y1 represents potential GDP.
(Multiple Choice)
4.9/5 (43)
One factor which brought on the recession of 2007-2009 was the end of the housing bubble.
(True/False)
4.9/5 (30)
New classical macroeconomic theory emphasizes the role of "sticky" prices in the economy.
(True/False)
4.8/5 (40)
Most recessions in the United States since World War II have begun with
(Multiple Choice)
4.8/5 (34)
In the dynamic aggregated demand and aggregate supply model,if AD shifts faster than AS,
(Multiple Choice)
4.8/5 (34)
Figure 13-1 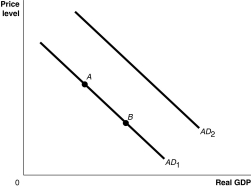 -Refer to Figure 13-1.Ceteris paribus,a decrease in interest rates would be represented by a movement from
(Multiple Choice)
4.8/5 (34)
An increase in the price level shifts the aggregate demand curve to the left.
(True/False)
4.8/5 (30)
Which of the following is considered a negative supply shock?
(Multiple Choice)
4.8/5 (32)
Figure 13-4 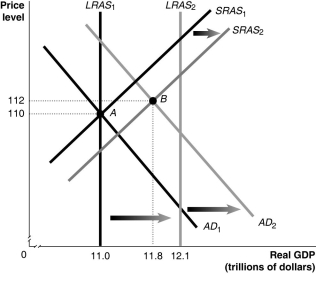 -Refer to Figure 13-4.Given the economy is at point A in year 1,what is the inflation rate between year 1 and year 2?
(Multiple Choice)
4.9/5 (27)
President Bush lowered income taxes for individuals in 2001.Explain how lower income taxes affect the aggregate demand curve.
(Essay)
4.8/5 (39)
Figure 13-3
-Refer to Figure 13-3.Suppose the economy is at point C.If government spending decreases in the economy,where will the eventual long-run equilibrium be?
(Multiple Choice)
4.8/5 (39)
According to the "wealth effect," when the ________ falls,the ________ rises.
(Multiple Choice)
4.8/5 (25)
Suppose there has been an increase in investment.As a result,real GDP will ________ in the short run,and ________ in the long run.
(Multiple Choice)
4.8/5 (31)
Figure 13-3
-Refer to Figure 13-3.Which of the points in the above graph are possible short-run equilibria?
(Multiple Choice)
4.9/5 (43)
Which of the following models relies on emphasizing the importance of sticky wages and prices?
(Multiple Choice)
4.8/5 (32)
Hurricane Katrina resulted in a decline in oil production infrastructure along the gulf coast.As a result there was an unexpected decline in oil and natural gas supplies in 2005.Suppose that this caused an increase in the price level and a decline in real GDP in 2006.Also assume that potential real GDP continued to grow due to other factors.You can assume the aggregate demand curve did not change.Show the macroeconomic equilibrium for 2005 and 2006 using the dynamic aggregate supply and aggregate demand model.
(Essay)
4.9/5 (24)
Filters
- Essay(0)
- Multiple Choice(0)
- Short Answer(0)
- True False(0)
- Matching(0)