Exam 5: Using Economics to Understand the World Around You
Exam 1: The Wealth of Nations: Ownership and Economic Freedom87 Questions
Exam 2: Scarcity and Opportunity Costs87 Questions
Exam 3: Markets and the Price System96 Questions
Exam 4: The Aggregate Economy61 Questions
Exam 5: Using Economics to Understand the World Around You68 Questions
Exam 6: Elasticity: Demand and Supply133 Questions
Exam 7: Demand: Consumer Choice142 Questions
Exam 8: Supply: the Costs of Doing Business105 Questions
Exam 9: Profit Maximization121 Questions
Exam 10: Perfect Competition135 Questions
Exam 11: Monopoly118 Questions
Exam 12: Monopolistic Competition and Oligopoly114 Questions
Exam 13: Markets and Government113 Questions
Exam 14: Antitrust and Regulation88 Questions
Exam 15: Resource Markets110 Questions
Exam 16: The Labor Market116 Questions
Exam 17: The Capital Market110 Questions
Exam 18: The Land Market and Natural Resources55 Questions
Exam 19: Current Issues: Income, Income Distribution, Poverty, and Government Policy85 Questions
Exam 20: World Trade Equilibrium112 Questions
Exam 21: International Trade Restrictions109 Questions
Exam 22: Exchange Rates and Financial Links Between Countries130 Questions
Select questions type
Scenario 4-1
In a given year, country A exported $12 million worth of goods to country B and $6 million worth of goods to country C; country B exported $4 million worth of goods to country A and $7 million worth of goods to country C; and country C exported $5 million worth of goods to country A and $2 million worth of goods to country B.
-Which of the following is a step that economists take in order to examine a real-world issue?
Free
(Multiple Choice)
4.9/5  (32)
(32)
Correct Answer: Verified
D
Figure 5.1. The figure shows a linear production possibility curve representing a tradeoff faced by a country, between necessities and luxuries. 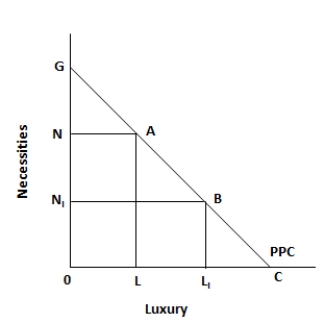 -To say that "there is a scarcity of gold" means that:
Free
(Multiple Choice)
4.9/5 (28)
Correct Answer:Verified
B
Figure 5.2. The figure shows the supply and demand curves of a firm. 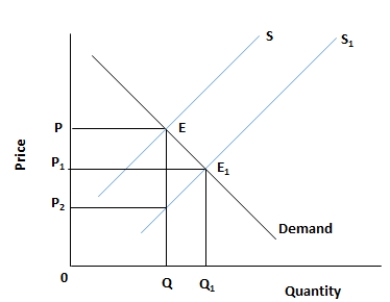 -Which of the following is a possible outcome of a minimum wage imposed by a government?
Free
(Multiple Choice)
5.0/5 (31)
Correct Answer:Verified
D
Figure 5.3. The figure shows the wage rate and the quantity of labor supplied in an unskilled labor market. 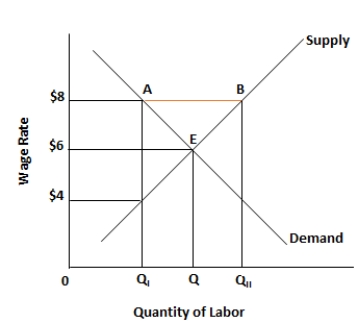 -The market process ensures that, when all transactions are voluntary, resources get allocated to the use where they are valued the most.
(True/False)
4.8/5 (38)
Scenario 4-1
In a given year, country A exported $12 million worth of goods to country B and $6 million worth of goods to country C; country B exported $4 million worth of goods to country A and $7 million worth of goods to country C; and country C exported $5 million worth of goods to country A and $2 million worth of goods to country B.
-Which of the following is likely to cause an outward shift of a production possibility curve?
(Multiple Choice)
4.9/5 (37)
Figure 5.2. The figure shows the supply and demand curves of a firm.
-Refer to figure 5.2. A shift in the supply curve from S to S1leads to:
(Multiple Choice)
4.8/5 (26)
Figure 5.1. The figure shows a linear production possibility curve representing a tradeoff faced by a country, between necessities and luxuries.
-Refer to figure 5.1. Suppose the country represented in the figure is a low income country. Given a voluntary choice, the country will choose to be:
(Multiple Choice)
4.7/5 (38)
Figure 5.2. The figure shows the supply and demand curves of a firm.
-Which of the following possibly determines the allocation of goods and services in a free market?
(Multiple Choice)
4.9/5 (42)
Figure 5.2. The figure shows the supply and demand curves of a firm.
-Which of the following helps in determining whether health care cost rises because of government policy, or because of demand rising faster than supply?
(Multiple Choice)
4.7/5 (43)
Figure 5.1. The figure shows a linear production possibility curve representing a tradeoff faced by a country, between necessities and luxuries.
-Which of the following is a possible cause of an increase in profit from the sale of goods and services?
(Multiple Choice)
5.0/5 (35)
Figure 5.3. The figure shows the wage rate and the quantity of labor supplied in an unskilled labor market.
-Refer to figure 5.3. Which of the following is a possible outcome of a fall in the wage rate from $6 to $4?
(Multiple Choice)
4.9/5 (35)
Figure 5.1. The figure shows a linear production possibility curve representing a tradeoff faced by a country, between necessities and luxuries.
-Refer to figure 5.1. A fall in the gross domestic product of the country will lead to:
(Multiple Choice)
4.9/5 (38)
Figure 5.2. The figure shows the supply and demand curves of a firm.
-Refer to figure 5.2. Which of the following is true?
(Multiple Choice)
4.7/5 (34)
Figure 5.1. The figure shows a linear production possibility curve representing a tradeoff faced by a country, between necessities and luxuries.
-The term self-interest, as viewed by economists, means that:
(Multiple Choice)
4.9/5 (35)
Figure 5.2. The figure shows the supply and demand curves of a firm.
-Which of the following is a possible cause of an increase in the demand for health care?
(Multiple Choice)
4.8/5 (37)
Figure 5.3. The figure shows the wage rate and the quantity of labor supplied in an unskilled labor market.
-Refer to figure 5.3. Suppose the government imposes a minimum wage of $8. Which of the following is a possible outcome of the imposition of a minimum wage above the equilibrium wage rate?
(Multiple Choice)
4.9/5 (34)
Figure 5.2. The figure shows the supply and demand curves of a firm.
-Which of the following is true?
(Multiple Choice)
4.7/5 (37)
Figure 5.3. The figure shows the wage rate and the quantity of labor supplied in an unskilled labor market.
-To examine a real-world issue, economists look at the real-world results to see how they differ from those of a free market.
(True/False)
5.0/5 (30)
Figure 5.3. The figure shows the wage rate and the quantity of labor supplied in an unskilled labor market.
-The lowest of the federal or state minimum wage levels prevails in each state.
(True/False)
4.8/5 (38)
Scenario 4-1
In a given year, country A exported $12 million worth of goods to country B and $6 million worth of goods to country C; country B exported $4 million worth of goods to country A and $7 million worth of goods to country C; and country C exported $5 million worth of goods to country A and $2 million worth of goods to country B.
-Which of the following is a possible advantage of a free market condition?
(Multiple Choice)
4.8/5 (34)
Filters
- Essay(0)
- Multiple Choice(0)
- Short Answer(0)
- True False(0)
- Matching(0)