Exam 3: Where Prices Come From: the Interaction of Demand and Supply
Exam 1: Economics: Foundations and Models160 Questions
Exam 2: Choices and Trade-Offs in the Market192 Questions
Exam 3: Where Prices Come From: the Interaction of Demand and Supply202 Questions
Exam 4: Elasticity: the Responsiveness of Demand and Supply226 Questions
Exam 5: Economic Efficiency, Government Price Setting and Taxes187 Questions
Exam 6: Consumer Choice and Behavioural Economics254 Questions
Exam 7: Technology, Production and Costs300 Questions
Exam 8: Firms in Perfectly Competitive Markets270 Questions
Exam 9: Monopoly Markets281 Questions
Exam 10: Monopolistic Competition253 Questions
Exam 11: Oligopoly: Firms in Less Competitive Markets186 Questions
Exam 12: The Markets for Labour and Other Factors of Production253 Questions
Exam 13: International Trade131 Questions
Exam 14: Government Intervention in the Market122 Questions
Exam 15: Externalities, Environmental Policy and Public Goods212 Questions
Exam 16: The Distribution of Income and Social Policy121 Questions
Select questions type
What is the difference between an 'increase in supply' and an 'increase in quantity supplied'?
(Multiple Choice)
4.9/5  (34)
(34)
A surplus occurs when the actual selling price is above the market equilibrium price.
(True/False)
4.8/5 (29)
An increase in the number of firms in a market will cause the quantity of a good supplied to increase.
(True/False)
4.8/5 (39)
If a firm has an incentive to increase supply now and decrease supply in the future,the firm expects that the
(Multiple Choice)
4.7/5 (35)
Figure 3-2 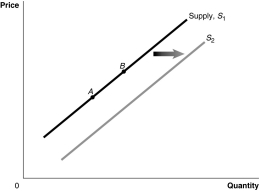 -Refer to Figure 3-2.A decrease in the expected future price of the product would be represented by a movement from
(Multiple Choice)
4.8/5 (40)
Suppose that when the price of raspberries increases,Lonnie increases his purchases of papayas.To Lonnie,
(Multiple Choice)
4.9/5 (38)
Select the phrase that correctly completes the following statement.'A positive change in technology caused an increase in the supply of flat-screen televisions.As a result,________.'
(Multiple Choice)
4.9/5 (39)
Figure 3-8 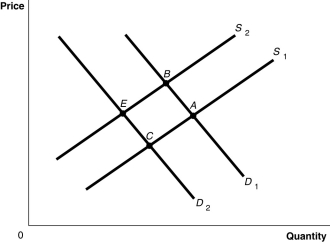 -Refer to Figure 3-8.The graph in this figure illustrates an initial competitive equilibrium in the market for apples at the intersection of D2 and S1 (point C).Which of the following changes would cause the equilibrium to change to point B?
(Multiple Choice)
4.7/5 (37)
A(n)________ is represented by a leftward shift of the demand curve while a(n)________ is represented by a movement along a given demand curve.
(Multiple Choice)
4.8/5 (30)
Which of the following is evidence of a surplus of bananas?
(Multiple Choice)
4.8/5 (38)
If consumers believe the price of LCD televisions will decrease in the future,this will cause the demand for LCD televisions to increase now.
(True/False)
4.7/5 (38)
Figure 3-8
-Refer to Figure 3-8.The graph in this figure illustrates an initial competitive equilibrium in the market for apples at the intersection of D1 and S1 (point A).If the price of oranges,a substitute for apples,decreases and the wages of apple workers increase,how will the equilibrium point change?
(Multiple Choice)
4.8/5 (30)
Table 3-1
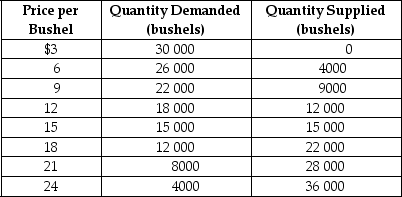 -Refer to Table 3-1.The table contains information about the corn market.Use the table to answer the following questions.
a.What are the equilibrium price and quantity of corn?
b.Suppose the prevailing price is $9 per bushel.Is there a shortage or a surplus in the market?
c.What is the quantity of the shortage or surplus?
d.How many bushels will be sold if the market price is $9 per bushel?
e.If the market price is $9 per bushel,what must happen to restore equilibrium in the market?
f.At what price will suppliers be able to sell 22 000 bushels of corn?
g.Suppose the market price is $21 per bushel.Is there a shortage or a surplus in the market?
h.What is the quantity of the shortage or surplus?
i.How many bushels will be sold if the market price is $21 per bushel?
j.If the market price is $21 per bushel,what must happen to restore equilibrium in the market?
-Refer to Table 3-1.The table contains information about the corn market.Use the table to answer the following questions.
a.What are the equilibrium price and quantity of corn?
b.Suppose the prevailing price is $9 per bushel.Is there a shortage or a surplus in the market?
c.What is the quantity of the shortage or surplus?
d.How many bushels will be sold if the market price is $9 per bushel?
e.If the market price is $9 per bushel,what must happen to restore equilibrium in the market?
f.At what price will suppliers be able to sell 22 000 bushels of corn?
g.Suppose the market price is $21 per bushel.Is there a shortage or a surplus in the market?
h.What is the quantity of the shortage or surplus?
i.How many bushels will be sold if the market price is $21 per bushel?
j.If the market price is $21 per bushel,what must happen to restore equilibrium in the market?
(Essay)
4.9/5 (29)
If the population increases and input prices decrease,the equilibrium quantity of a product will definitely increase.
(True/False)
4.7/5 (39)
The law of demand implies,holding everything else constant,that as the price of ice cream
(Multiple Choice)
4.8/5 (36)
If the price of refillable butane lighters was to decrease,then
(Multiple Choice)
4.8/5 (39)
When deciding on which new products to develop,a firm must devote people,time,and money to designing a new product.Because any firm has only limited resources,it
(Multiple Choice)
4.8/5 (25)
Figure 3-2
-Refer to Figure 3-2.An increase in the number of firms in the market would be represented by a movement from
(Multiple Choice)
4.9/5 (36)
Filters
- Essay(0)
- Multiple Choice(0)
- Short Answer(0)
- True False(0)
- Matching(0)