Exam 9: Monopoly Markets
Exam 1: Economics: Foundations and Models160 Questions
Exam 2: Choices and Trade-Offs in the Market192 Questions
Exam 3: Where Prices Come From: the Interaction of Demand and Supply202 Questions
Exam 4: Elasticity: the Responsiveness of Demand and Supply226 Questions
Exam 5: Economic Efficiency, Government Price Setting and Taxes187 Questions
Exam 6: Consumer Choice and Behavioural Economics254 Questions
Exam 7: Technology, Production and Costs300 Questions
Exam 8: Firms in Perfectly Competitive Markets270 Questions
Exam 9: Monopoly Markets281 Questions
Exam 10: Monopolistic Competition253 Questions
Exam 11: Oligopoly: Firms in Less Competitive Markets186 Questions
Exam 12: The Markets for Labour and Other Factors of Production253 Questions
Exam 13: International Trade131 Questions
Exam 14: Government Intervention in the Market122 Questions
Exam 15: Externalities, Environmental Policy and Public Goods212 Questions
Exam 16: The Distribution of Income and Social Policy121 Questions
Select questions type
Figure 9-4 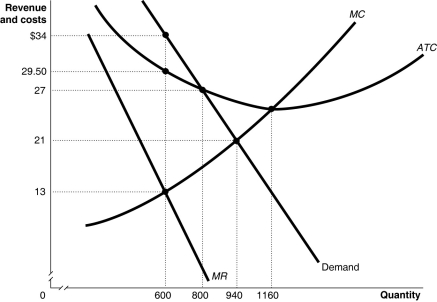 Figure 9-4 shows the demand and cost curves for a monopolist.
-Refer to Figure 9-4.What is the amount of the monopoly's total revenue?
Figure 9-4 shows the demand and cost curves for a monopolist.
-Refer to Figure 9-4.What is the amount of the monopoly's total revenue?
(Multiple Choice)
4.9/5  (33)
(33)
A snack shop inside a hotel in a busy city has a monopoly on food sales if it is the only food vendor in the hotel that is open 24 hours a day.
(True/False)
4.9/5 (42)
A successful strategy of price discrimination requires that a firm be a price-taker.
(True/False)
4.8/5 (28)
Which one of the following is not a possible barrier to entry high enough to keep competing firms out of a monopoly industry?
(Multiple Choice)
4.9/5 (45)
Figure 9-2 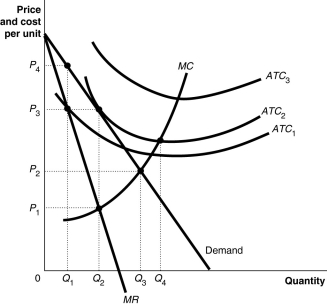 Figure 9-2 above shows the demand and cost curves facing a monopolist.
-Refer to Figure 9-2.If the firm's average total cost curve is ATC3,the firm will
Figure 9-2 above shows the demand and cost curves facing a monopolist.
-Refer to Figure 9-2.If the firm's average total cost curve is ATC3,the firm will
(Multiple Choice)
4.8/5 (39)
When a proposed merger between two companies is reviewed by the government,the relevant market is defined by
(Multiple Choice)
4.8/5 (36)
One reason why airlines charge business travelers and leisure travelers different prices is
(Multiple Choice)
4.9/5 (31)
Figure 9-4 Figure 9-4 shows the demand and cost curves for a monopolist.
-Refer to Figure 9-4.What is likely to happen to this monopoly in the long run?
(Multiple Choice)
4.9/5 (26)
A product's price approaches its marginal cost as market concentration increases.
(True/False)
4.8/5 (32)
Figure 9-7 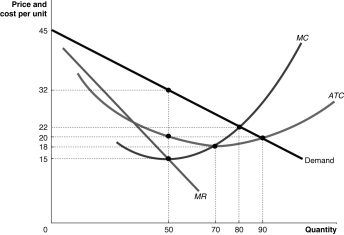 -Refer to Figure 9-7.Use the figure above to answer the following questions.
a.What is the profit-maximising quantity and what price will the monopolist charge?
b.What is the total revenue at the profit-maximising output level?
c.What is the total cost at the profit-maximising output level?
d.What is the profit?
e.What is the profit per unit (average profit)at the profit-maximising output level?
f.If this industry was organised as a perfectly competitive industry,what would be the profit-maximising price and quantity?
-Refer to Figure 9-7.Use the figure above to answer the following questions.
a.What is the profit-maximising quantity and what price will the monopolist charge?
b.What is the total revenue at the profit-maximising output level?
c.What is the total cost at the profit-maximising output level?
d.What is the profit?
e.What is the profit per unit (average profit)at the profit-maximising output level?
f.If this industry was organised as a perfectly competitive industry,what would be the profit-maximising price and quantity?
(Essay)
4.8/5 (27)
Which of the following is not a way by which price-discriminating firms can segment a market?
(Multiple Choice)
4.8/5 (30)
Figure 9-3 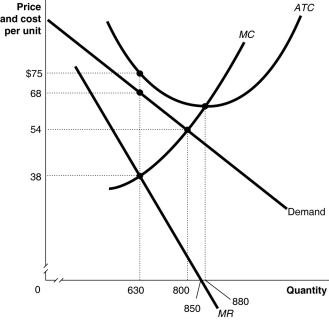 Figure 9-3 above shows the demand and cost curves facing a monopolist.
-Refer to Figure 9-3.Suppose the monopolist represented in the diagram above produces positive output.What is the price charged at the profit-maximising/loss-minimising output level?
Figure 9-3 above shows the demand and cost curves facing a monopolist.
-Refer to Figure 9-3.Suppose the monopolist represented in the diagram above produces positive output.What is the price charged at the profit-maximising/loss-minimising output level?
(Multiple Choice)
4.9/5 (40)
Figure 9-16 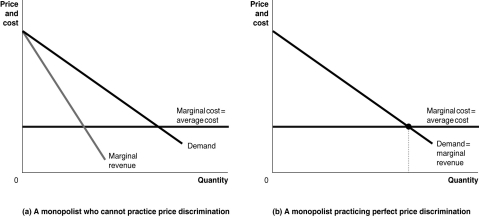 -Refer to Figure 9-16.Graph (a)represents a monopolist who cannot price discriminate and graph (b)represents a monopolist practicing perfect price discrimination.On each graph,identify the monopoly price,the monopoly output,the efficient output,and the areas representing profit,consumer surplus,and deadweight loss.
(Essay)
4.9/5 (26)
Figure 9-10 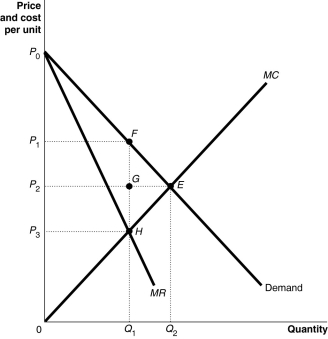 -Refer to Figure 9-10.Compared to a perfectly competitive market,consumer surplus is lower in a monopoly by an amount equal to the
(Multiple Choice)
4.8/5 (43)
Experience with patents in the pharmaceutical industry shows that when patents on drugs expire,
(Multiple Choice)
4.8/5 (34)
Filters
- Essay(0)
- Multiple Choice(0)
- Short Answer(0)
- True False(0)
- Matching(0)