Exam 15: Consumption
Exam 1: Introduction to Macroeconomics34 Questions
Exam 2: Measuring the Macroeconomy98 Questions
Exam 3: An Overview of Long- Run Economic Growth102 Questions
Exam 4: A Model of Production113 Questions
Exam 5: The Solow Growth Model116 Questions
Exam 6: Growth and Ideas102 Questions
Exam 7: The Labor Market,wages,and Unemployment100 Questions
Exam 8: Inflation99 Questions
Exam 9: An Introduction to the Short Run96 Questions
Exam 10: The Great Recession: a First Look95 Questions
Exam 11: The Is Curve101 Questions
Exam 12: Monetary Policy and the Phillips Curve100 Questions
Exam 13: Stabilization Policy and the Asad Framework97 Questions
Exam 14: The Great Recession and the Short-Run Model99 Questions
Exam 15: Consumption98 Questions
Exam 16: Investment101 Questions
Exam 17: The Government and the Macroeconomy96 Questions
Exam 18: International Trade96 Questions
Exam 19: Exchange Rates and International Finance109 Questions
Exam 20: Parting Thoughts31 Questions
Select questions type
The left hand side of the Euler equation,  ,represents total lifetime consumption,in dollars.
Free
(True/False)
4.8/5  (34)
(34)
Correct Answer: Verified
False
Between 1970 and 2008 household consumption ___________ of GDP.Over this period,___________ to about ___________ of GDP.
Free
(Multiple Choice)
4.9/5 (38)
Correct Answer:Verified
D
Because people can't perfectly foresee income changes over their lifetime,consumption should:
(Multiple Choice)
4.8/5 (42)
For the following questions refer to Figure 15.3 below. 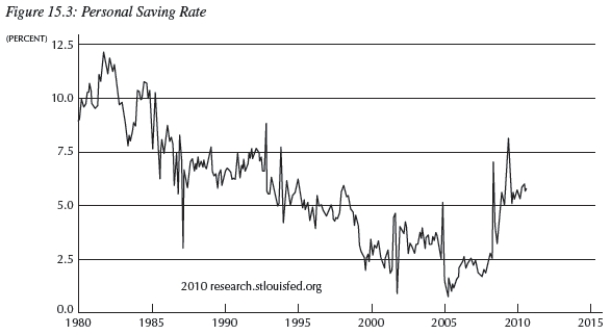 -Consider Figure 15.3.A possible cause for the change in the saving rate after,about,2007 is:
(Multiple Choice)
4.9/5 (26)
In 1992,the first Bush administration was worried about a lingering recession.The administration announced that households would receive a reduction in their taxes for the year 1992.However,this was not accompanied by a reduction in tax rates,and the taxes would have to be repaid when households filed their taxes in April 1993.Explain what the impact of such a policy would be.
(Essay)
4.7/5 (34)
Consider two time periods: t and k.Which of the following would represent the "future's" budget constraint?
(Multiple Choice)
4.9/5 (49)
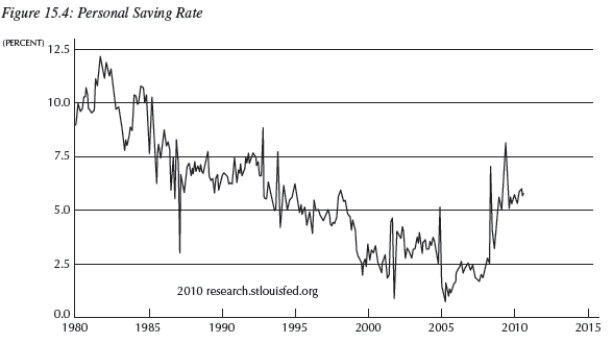 -Consider Figure 15.4 below,which shows the U.S.personal savings rate.A likely explanation for the rise in savings rates after 2009 is the continued strength in stock and housing markets.
(True/False)
4.8/5 (34)
Use Figure 15.2 to answer the following questions. 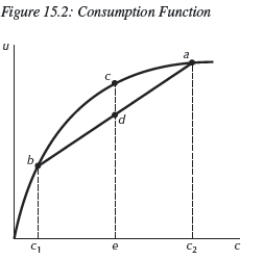 -In Figure 15.2,the point c is equal to ___________ and implies __________.
(Multiple Choice)
4.9/5 (32)
Using the neoclassical model of consumption,an implication of the permanent income hypothesis is ___________ because of __________.
(Multiple Choice)
4.7/5 (40)
One of the implications of the intertemporal budget constraint is that:
(Multiple Choice)
4.9/5 (30)
According to the neoclassical model ___________ over their lifetime,however one study showed that ___________ at retirement.This puzzle was solved when two economist tested the neoclassical model using __________.
(Multiple Choice)
4.8/5 (35)
If moving an extra unit of future consumption to today's consumption improves your lifetime utility you are not:
(Multiple Choice)
4.8/5 (34)
Filters
- Essay(0)
- Multiple Choice(0)
- Short Answer(0)
- True False(0)
- Matching(0)