Exam 12: Monetary Policy and the Phillips Curve
Exam 1: Introduction to Macroeconomics34 Questions
Exam 2: Measuring the Macroeconomy98 Questions
Exam 3: An Overview of Long- Run Economic Growth102 Questions
Exam 4: A Model of Production113 Questions
Exam 5: The Solow Growth Model116 Questions
Exam 6: Growth and Ideas102 Questions
Exam 7: The Labor Market,wages,and Unemployment100 Questions
Exam 8: Inflation99 Questions
Exam 9: An Introduction to the Short Run96 Questions
Exam 10: The Great Recession: a First Look95 Questions
Exam 11: The Is Curve101 Questions
Exam 12: Monetary Policy and the Phillips Curve100 Questions
Exam 13: Stabilization Policy and the Asad Framework97 Questions
Exam 14: The Great Recession and the Short-Run Model99 Questions
Exam 15: Consumption98 Questions
Exam 16: Investment101 Questions
Exam 17: The Government and the Macroeconomy96 Questions
Exam 18: International Trade96 Questions
Exam 19: Exchange Rates and International Finance109 Questions
Exam 20: Parting Thoughts31 Questions
Select questions type
If prices are sticky and there are no aggregate demand shocks,and if the Fed raises the interest rate,__________ and __________.
Free
(Multiple Choice)
4.8/5  (31)
(31)
Correct Answer: Verified
D
The term structure of interest rates is a way of looking at bond rates with different maturity periods.
Free
(True/False)
4.8/5 (45)
Correct Answer:Verified
True
If the central bank is targeting the money supply,the money supply is __________ and __________ the nominal interest rate.
(Multiple Choice)
4.9/5 (36)
Which of the following is (are)the mission of the Federal Reserve Bank?
i.Preserve price stability.
ii.Foster economic growth and employment.
iii.Ensure taxes are fair.
(Multiple Choice)
4.7/5 (37)
Economists who study monetary policy believe that it takes anywhere from __________ for monetary policy to have a substantial effect on economic activity.
(Multiple Choice)
4.8/5 (29)
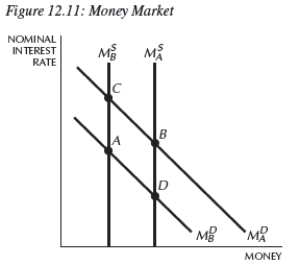 -Starting at any equilibrium in Figure 12.11,if the Fed loosens money,the money market would move from:
(Multiple Choice)
4.8/5 (42)
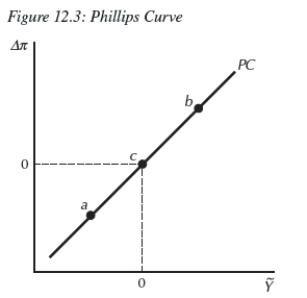 -Consider the Phillips curve in Figure 12.3.At point b,__________,and at point a,__________.
(Multiple Choice)
4.9/5 (31)
In March and April 1980,inflation in the United States peaked at 14.6 percent.What did then-Fed Chairman Volcker elect to do? What was the impact of his policy?
(Essay)
4.8/5 (30)
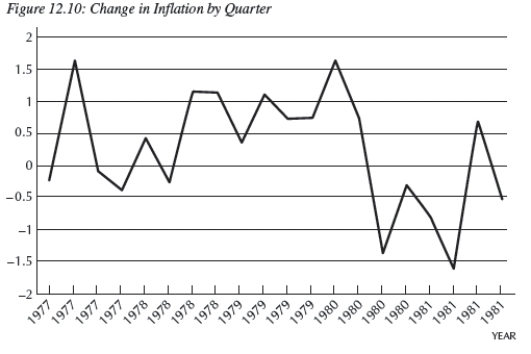 -Consider Figure 12.10,which shows the change in inflation
  From 1977.1 to 1981.4,by quarter.You are Federal Reserve chairman Volcker and today's date is the first quarter of 1980 (1980.1).You suggest the appropriate policy would be to __________.In 1981.2,you consider your performance,and you conclude that you __________;using the Phillips curve,you see the country is now in __________.
(Multiple Choice)
4.8/5 (37)
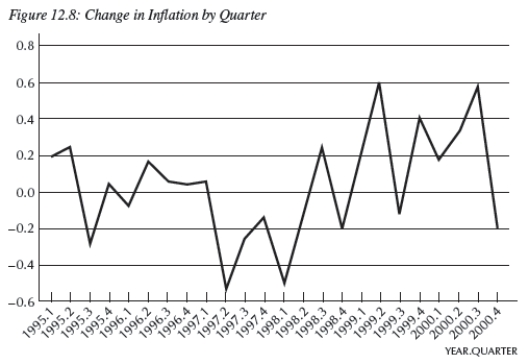 -Consider Figure 12.8,which shows the change in inflation
  From 1995.1 to 2000.4,by quarter.You are Federal Reserve chairman Greenspan and today's date is the first quarter of 1999 (1999.1).Given the information you have,using the Phillips curve,to stabilize the economy,you would __________,risking __________.
(Multiple Choice)
4.9/5 (43)
The link between real and nominal interest rates is the Fisher equation.
(True/False)
4.8/5 (35)
Which of the following contributed to high levels of inflation in the 1970s?
i.Soviet invasion of Afghanistan
ii.loose monetary policy
iii.a productivity slowdown
(Multiple Choice)
4.8/5 (31)
Which of the following innovations has (have)become commonplace in financial markets over the past few decades?
(Multiple Choice)
4.7/5 (31)
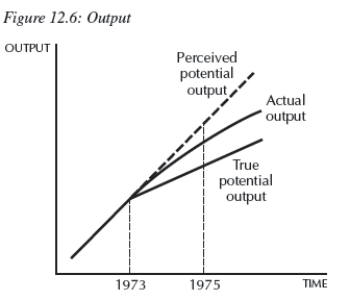 -Consider Figure 12.6.You are chairman of the Federal Reserve in 1975.You believe potential output follows the dotted line after 1973,but in actuality,it follows the line denoted "True potential output." The current state of the economy is given by the curve "Actual output." Given the information in the figure,you __________,because you believe the economy is in a __________;but your advice instead __________.
(Multiple Choice)
4.9/5 (41)
Filters
- Essay(0)
- Multiple Choice(0)
- Short Answer(0)
- True False(0)
- Matching(0)