Exam 3: Applications of the Derivative
Exam 1: Functions, graphs, and Limits427 Questions
Exam 2: Differentiation84 Questions
Exam 3: Applications of the Derivative122 Questions
Exam 4: Exponential and Logarithmic Functions122 Questions
Exam 5: Integration and Its Applications88 Questions
Exam 6: Techniques of Integration46 Questions
Exam 7: Functions of Several Variables113 Questions
Exam 8: Trigonometric Functions60 Questions
Exam 9: Probability and Calculus36 Questions
Exam 10: Series and Taylor Polynomials104 Questions
Exam 11: Differential Equations77 Questions
Select questions type
Suppose the sales S (in billions of dollars per year)for Proctor & Gamble for the years 1997 through 2002 can be modeled by 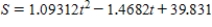 ,
,  where t represents the year.During which year were the sales increasing at the lowest rate?
(Multiple Choice)
4.8/5  (41)
(41)
Determine the dimensions of a rectangular solid (with a square base)with maximum volume if its surface area is 441 square meters.
(Multiple Choice)
4.8/5 (43)
Sketch the graph of the function  using any extrema,intercepts,symmetry,and asymptotes.
(Multiple Choice)
4.9/5 (36)
Compare dy and Δy for  at x = 1 with dx = -0.01.Give your answers to four decimal places.
(Multiple Choice)
4.9/5 (43)
Sketch the graph of the function below.Choose a scale that allows all relative extrema and points of inflection to be identified on the graph. 
(Multiple Choice)
4.9/5 (44)
The number of people who donated to a certain organization between 1975 and 1992 can be modeled by the equation  donors,where t is the number of years after 1975.Find the inflection point(s)from
  through
  ,if any exist.
(Multiple Choice)
4.8/5 (36)
Analytically determine the location(s)of any horizontal asymptote(s).
(Multiple Choice)
5.0/5 (39)
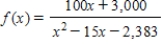
p is in dollars and q is the number of units.Find the elasticity of the demand function  at the price
(Multiple Choice)
4.9/5 (33)
Find the point on the graph of  that is closest to the point (8,0.5).Round your answer to two decimal places.
(Multiple Choice)
4.9/5 (36)
Find the absolute extrema of the function  on the interval
(Multiple Choice)
4.7/5 (36)
Use the graph of  to identify at which of the indicated points the derivative
  changes from negative to positive.
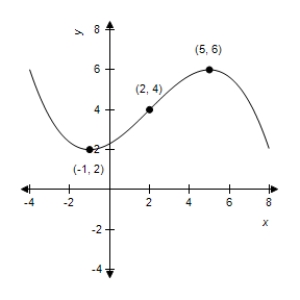
(Multiple Choice)
4.9/5 (43)
A power station is on one side of a river that is 0.5 mile wide,and a factory is 6 miles downstream on the other side of the river.It costs $14 per foot to run overland power lines and $20 per foot to run underwater power lines.Estimate the value of x that minimizes the cost.The value of  is the length of the overland piece of power line.
(Multiple Choice)
4.7/5 (39)
Sketch a graph of a function f having the following characteristics.
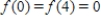
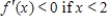

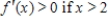

(Multiple Choice)
4.8/5 (38)
The variable cost for the production of a calculator is $13.75 and the initial investment is $210,000.Use differentials to approximate the change in the cost C for a one-unit increase in production when  ,where x is the number of units produced.
(Multiple Choice)
4.9/5 (29)
Production.Suppose that the total number of units produced by a worker in t hours of an 8-hour shift can be modeled by the production function 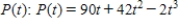 Find the number of hours before the rate of production is maximized.That is,find the point of diminishing returns.
(Multiple Choice)
4.9/5 (44)
Find all relative extrema of the function  Use the Second-Derivative Test when applicable.
(Multiple Choice)
4.8/5 (38)
A firm can produce 100 units per week.If its total cost function is 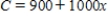 dollars,and its total revenue function is
  dollars,find the maximum profit.
(Multiple Choice)
4.9/5 (43)
Filters
- Essay(0)
- Multiple Choice(0)
- Short Answer(0)
- True False(0)
- Matching(0)