Exam 2: Functions and Graphs
Exam 1: Fundamental Concepts of Algebra119 Questions
Exam 1: Equations and Inequalities94 Questions
Exam 2: Functions and Graphs97 Questions
Exam 3: Polynomial and Rational Functions105 Questions
Exam 4: Exponential and Logarithmic Functions92 Questions
Exam 5: Systems of Equations and Inequalities94 Questions
Exam 6: Matrices and Determinants94 Questions
Exam 7: Sequences, Series, and Probability92 Questions
Select questions type
Determine whether lines L1 and L2 passing through the pairs of points are parallel, perpendicular, or neither. L1 : (1, 2), (1, 4)
L2 : (-7, -8), (-9, -8)
Free
(Multiple Choice)
4.9/5  (35)
(35)
Correct Answer: Verified
B
The national defense budget expenses  (in billions of dollars) for veterans in the United States from 1990 to 2005 can be approximated by the model
 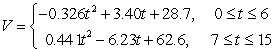 where
where  represents the year, with
  corresponding to 1990.Use the model to find total veteran expenses in 2002.
Free
(Multiple Choice)
4.9/5 (36)
Correct Answer:Verified
B
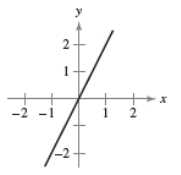
Use the graph of  to write equations for the functions whose graphs are shown.
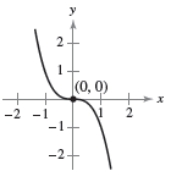
(Multiple Choice)
4.9/5 (42)
Use the graph of  to write an equation for the function whose graph is shown.
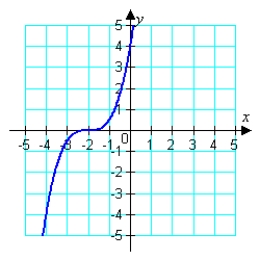
(Multiple Choice)
5.0/5 (33)
Describe the increasing, decreasing, and constant behavior of the function.Find the point or points where the behavior of the function changes. 
(Multiple Choice)
4.8/5 (30)
Graph the following equation by plotting points that satisfy the equation. 
(Multiple Choice)
4.9/5 (39)
Consider the graph of  Use your knowledge of rigid and nonrigid transformations to write an equation for the following descriptions. The graph of
  is shifted three units to the left.
(Multiple Choice)
4.7/5 (41)
Consider the graph of  Use your knowledge of rigid and nonrigid transformations to write an equation for the following descriptions. The graph of
  is reflected in the x-axis, shifted five units to the left, and shifted four unit upward.
(Multiple Choice)
4.9/5 (33)
Given  , use the algebraic tests to determine symmetry with respect to both axes and the origin.
(Multiple Choice)
4.7/5 (34)
Find the distance between the points.Round to the nearest hundredth, if necessary. (9, 2), (5, 5)
(Multiple Choice)
4.8/5 (35)
Evaluate the function at the specified value of the independent variable and simplify. f (y) = 6y + 3; f (0.8)
(Multiple Choice)
4.9/5 (37)
The weekly profit  (in hundreds of dollars) for a business from a product is given by the model
 where
where  is the amount (in hundreds of dollars) spent on advertising.Rewrite the profit equation so that
  measures advertising expenditures in dollars.
(Multiple Choice)
4.8/5 (37)
The marketing department of a company estimates that the demand for a product is given by  where
where  is the price per unit and
  is the number of units.The cost
  of producing
  units is given by
  and the profit
  for producing and selling
  units is given by
  Sketch the graph of the profit function and estimate the number of units that would produce a maximum profit.
(Multiple Choice)
4.8/5 (40)
Determine whether lines L1 and L2 passing through the pairs of points are parallel, perpendicular, or neither. L1 : (-5, -5), (4, 6)
L2 : (-9, 8), (-18, -3)
(Multiple Choice)
4.8/5 (29)
Filters
- Essay(0)
- Multiple Choice(0)
- Short Answer(0)
- True False(0)
- Matching(0)