Exam 2: Functions and Graphs
Exam 1: Fundamental Concepts of Algebra119 Questions
Exam 1: Equations and Inequalities94 Questions
Exam 2: Functions and Graphs97 Questions
Exam 3: Polynomial and Rational Functions105 Questions
Exam 4: Exponential and Logarithmic Functions92 Questions
Exam 5: Systems of Equations and Inequalities94 Questions
Exam 6: Matrices and Determinants94 Questions
Exam 7: Sequences, Series, and Probability92 Questions
Select questions type
The inventor of a new game believes that the variable cost of producing the game is $3.65 per unit and the fixed costs are $5000.The inventor sells each game for $11.09.Let  be the number of games sold.Write the average cost per unit
  as a function of
  where
where  is defined as the total cost of producing
  games.
(Multiple Choice)
4.8/5  (38)
(38)
Plot the points and find the slope of the line passing through the pair of points. (2, -4), (4, -1) 
(Multiple Choice)
4.9/5 (40)
Assume that y is directly proportional to x.If  and
and  , determine a linear model that relates y and x.
(Multiple Choice)
4.8/5 (31)
Describe the sequence of transformations from  to
to  Then sketch the graph of
  by hand.Verify with a graphing utility.
(Multiple Choice)
4.8/5 (36)
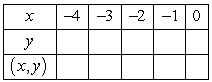
After completing the table, use the resulting solution points to sketch the graph of the equation 
(Essay)
4.9/5 (44)
Match the equation below with its graph.  Graph I :
 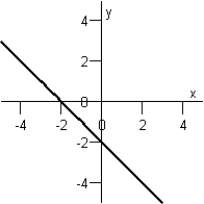 Graph IV :
 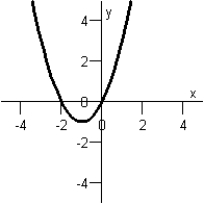 Graph II :
 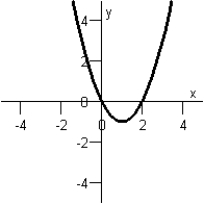 Graph V :
 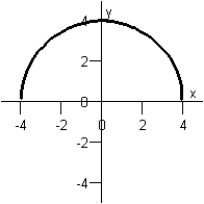 Graph III :
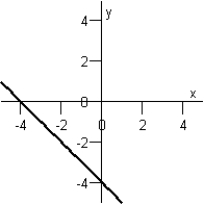
(Multiple Choice)
4.7/5 (33)
Describe the sequence of transformations from  to
to  Then sketch the graph of
  by hand.Verify with a graphing utility.
(Multiple Choice)
4.7/5 (25)
Write the equation that expresses the relationship between the variables described below, then use the given data to solve for the variation of constant. "t varies directly as  , and
, and  when
when  "
"
(Multiple Choice)
4.8/5 (34)
Find the slope and y-intercept of the equation of the line. 
(Multiple Choice)
4.9/5 (36)
Which set of ordered pairs represents a function from P to Q? P = {5, 10, 15, 20} Q = {-1, 1, 3}
(Multiple Choice)
4.9/5 (31)
Suppose the average remaining lifetime for women in a given country is given in the following table. 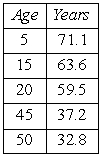 Find the linear regression equation for these data, whose parameters are rounded to the nearest hundredth, where x is the age, in years, and A is the remaining lifetime, in years.Use the regression equation to estimate the remaining lifetime for a 30-year old woman.
(Multiple Choice)
4.8/5 (28)
Find the slope and y-intercept of the equation of the line. -y - 8x = -2
(Multiple Choice)
4.9/5 (40)
Determine whether lines L1 and L2 passing through the pairs of points are parallel, perpendicular, or neither. L1 : (-1, 8), (9, -4)
L2 : (0, 9), (1, -1)
(Multiple Choice)
4.9/5 (43)
Use the graph of the function to find the domain and range of f. 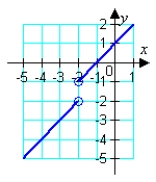
(Multiple Choice)
4.8/5 (36)
Find the x- and y-intercepts of the graph of the equation below. 
(Multiple Choice)
4.9/5 (34)
The point  on the graph of
  has been shifted to the point
  after a rigid transformation.Identify the shift and write the new function
  in terms of
(Multiple Choice)
4.9/5 (30)
Filters
- Essay(0)
- Multiple Choice(0)
- Short Answer(0)
- True False(0)
- Matching(0)