Exam 5: Systems of Equations and Inequalities
Exam 1: Fundamental Concepts of Algebra119 Questions
Exam 1: Equations and Inequalities94 Questions
Exam 2: Functions and Graphs97 Questions
Exam 3: Polynomial and Rational Functions105 Questions
Exam 4: Exponential and Logarithmic Functions92 Questions
Exam 5: Systems of Equations and Inequalities94 Questions
Exam 6: Matrices and Determinants94 Questions
Exam 7: Sequences, Series, and Probability92 Questions
Select questions type
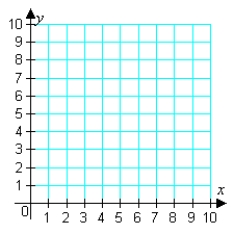
Find the minimum and maximum values of the objective function and where they occur, subject to the indicated constraints.(You should graph the feasible solutions on the grid below before you attempt to find the minimum and maximum values.) Objective function:  Constraints:
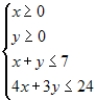
(Multiple Choice)
4.8/5  (35)
(35)
A total of $28,000 is invested in two corporate bonds that pay 11% and 4% simple interest.The total annual interest is $2170.How much is invested in the 4% bond?
(Multiple Choice)
4.7/5 (37)
An airplane flying into a headwind travels 280 miles in 2 hours and 48 minutes.On the return flight, the distance is traveled in 2 hours.Find the airspeed of the plane and the speed of the wind, assuming that both remain constant.
(Multiple Choice)
4.8/5 (40)
A fruit juice company makes two drinks by blending apple and pineapple juices.The percent of apple juice and pineapple juice in each drink are shown in the table. 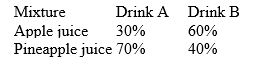 There are 1000 liters of apple and 1500 liters of pineapple juice available.The profit for drink A is $0.70 per liter and the profit for drink B is $0.60 per liter.What is the optimal production level for each type of drink? What is the optimal profit?
(Multiple Choice)
4.8/5 (38)
Solve the system below by elimination if possible.Then state whether the system below is consistent or inconsistent. 
(Multiple Choice)
4.8/5 (43)
Sketch the graph and label the vertices of the solution set of the system of inequalities.Shade the solution set. 
(Multiple Choice)
4.8/5 (37)
A company makes two models of doghouses.The times (in hours) required for assembling, painting, and packaging are shown in the table. 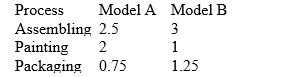 The total times available for assembling, Painting, and packaging are 4000 hours, 2500 hours, and 1500 hours, respectively.The profits per unit are $60 for model A and $75 for model B.what is the optimal production level for each model? What is the optimal profit?
(Multiple Choice)
4.7/5 (44)
Find the sales necessary to break even (R - C = 0) for the cost C of producing x units and the revenue R obtained by selling x units.(Round to the nearest whole unit.) 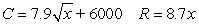
(Multiple Choice)
4.7/5 (39)
A residential building contractor borrowed $31,000 to complete a new home.Some of the money was borrowed at 5%, some at 7%, and some at 9%.How much was borrowed at each rate if the annual interest owed was $2050 and the amount borrowed at 7% is three times more than the amount borrowed at 9%?
(Multiple Choice)
4.9/5 (45)
A company has budgeted a maximum of $1,200,000 for national advertising an allergy medication.Each minute of television time costs $120,000 and each one-page newspaper ad costs $60,000.Each television ad is expected to be viewed by 24 million viewers, and each newspaper ad is expected to be seen by 7 million readers.What is the optimal amount that should be spent on advertising for each type ad?
(Multiple Choice)
4.7/5 (38)
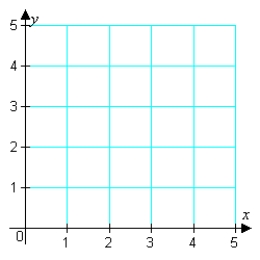
Derive a set of inequalities to describe the region. Triangle: vertices at (0, 0), (5, 0), (5, 4)
(Multiple Choice)
4.9/5 (46)
The concentration  (in parts per million) of carbon dioxide in the atmosphere is measured at the Mauna Loa Observatory in Hawaii.The greatest monthly carbon dioxide concentration for each year from 2002 to 2006 is shown in the table.
 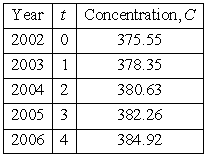 Solve the following system for
  and
and  to find the least squares regression line
  for the data.Let
  represent the year, with
  corresponding to 2002.
 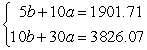 Use the least square regression line to predict the largest monthly carbon dioxide concentration in 2014.Round your answer to the nearest hundredths part per million.
(Multiple Choice)
4.8/5 (37)
The federal debt of the United States as a percentage of the Gross Domestic Product (GDP) from 2001 to 2005 is shown in the table.In the table,  represents the year, with
  corresponding to 2002.
 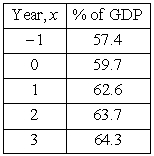 Find the least squares regression parabola
 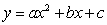 for the data by solving the following system.
 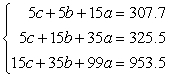 Use the model to predict the federal debt as percents of GDP in 2010.Round to the nearest tenth percents.
(Multiple Choice)
4.9/5 (38)
Filters
- Essay(0)
- Multiple Choice(0)
- Short Answer(0)
- True False(0)
- Matching(0)