Exam 6: Modelling Real Gdp and the Price Level in the Long Run
Exam 1: The Nature of Economics171 Questions
Exam 2: Production Possibilities and Economic Systems137 Questions
Exam 3: Demand and Supply177 Questions
Exam 4: Introduction to Macroeconomics112 Questions
Exam 5: Measuring the Economys Performance106 Questions
Exam 6: Modelling Real Gdp and the Price Level in the Long Run115 Questions
Exam 7: Economic Growth and Development109 Questions
Exam 8: Modelling Real Gdp and the Price Level in the Short Run115 Questions
Exam 9: Consumption, investment, and the Multiplier120 Questions
Exam 10: The Public Sector129 Questions
Exam 11: Fiscal Policy and the Public Debt116 Questions
Exam 12: Money and the Banking System112 Questions
Exam 13: Money Creation and Deposit Insurance115 Questions
Exam 14: The Bank of Canada and Monetary Policy131 Questions
Exam 15: Issues in Stabilization Policy115 Questions
Exam 16: Comparative Advantage and the Open Economy92 Questions
Exam 17: Exchange Rates and the Balance of Payments105 Questions
Select questions type
Figure 6-1 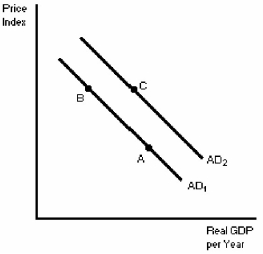 -In Figure 6-1,a movement from point B to point A can be explained by
(Multiple Choice)
4.9/5  (38)
(38)
Compare and contrast the demand and supply side of inflation.Which is preferable?
(Essay)
4.8/5 (41)
The full-employment and full adjustment level of real output of goods and services in the economy is represented by
(Multiple Choice)
4.9/5 (34)
Figure 6-1
-In Figure 6-1,a movement from point C to point B could be explained by
(Multiple Choice)
4.8/5 (36)
Because we have full employment at the level of potential output,
(Multiple Choice)
4.9/5 (40)
If other factors are held constant,an increase in the price level
(Multiple Choice)
4.9/5 (39)
An indirect effect because price level increases cause borrowing to increase,which raises interest rates and reduces quantity demanded for goods and services is known as:
(Multiple Choice)
4.8/5 (41)
An individual holds $20 000 in an interest-earning checking account earning 10% interest,and the overall price level rises by 12%.Other things constant,we would expect
(Multiple Choice)
4.8/5 (33)
Holding nominal money balances constant,a decrease in the price level
(Multiple Choice)
4.8/5 (45)
The aggregate demand curve shows that,if other factors are held constant,
(Multiple Choice)
4.8/5 (38)
Figure 6-1
-In Figure 6-1,a movement from point B to point C could be explained by
(Multiple Choice)
4.9/5 (38)
Describe what happens in the economy when there is an increase in the level of the factors of production (the endowment)in the short run and long run.
(Essay)
4.9/5 (35)
Filters
- Essay(0)
- Multiple Choice(0)
- Short Answer(0)
- True False(0)
- Matching(0)