Exam 5: Extension A: Integrals
Exam 1: Extension A: Functions and Models20 Questions
Exam 1: Extension B: Functions and Models5 Questions
Exam 1: Extension C: Functions and Models8 Questions
Exam 1: Extension D: Functions and Models12 Questions
Exam 1: Extension E: Functions and Models7 Questions
Exam 1: Extension F: Functions and Models5 Questions
Exam 2: Extension A: Limits and Derivatives9 Questions
Exam 2: Extension B: Limits and Derivatives5 Questions
Exam 2: Extension C: Limits and Derivatives6 Questions
Exam 2: Extension D: Limits and Derivatives6 Questions
Exam 2: Extension E : Limits and Derivatives5 Questions
Exam 2: Extension F: Limits and Derivatives5 Questions
Exam 2: Extension G: Limits and Derivatives10 Questions
Exam 2: Extension H: Limits and Derivatives5 Questions
Exam 3: Extension A: Differentiation Rules5 Questions
Exam 3: Extension B: Differentiation Rules11 Questions
Exam 3: Extension C: Differentiation Rules8 Questions
Exam 3: Extension D: Differentiation Rules5 Questions
Exam 3: Extension E: Differentiation Rules4 Questions
Exam 3: Extension F: Differentiation Rules5 Questions
Exam 3: Extension G: Differentiation Rules5 Questions
Exam 4: Extension A: Applications of Differentiation17 Questions
Exam 4: Extension B: Applications of Differentiation8 Questions
Exam 4: Extension C: Applications of Differentiation15 Questions
Exam 4: Extension D: Applications of Differentiation5 Questions
Exam 4: Extension E: Applications of Differentiation12 Questions
Exam 4: Extension F: Applications of Differentiation5 Questions
Exam 4: Extension G: Applications of Differentiation12 Questions
Exam 5: Extension A: Integrals5 Questions
Exam 5: Extension B: Integrals10 Questions
Exam 5: Extension C: Integrals7 Questions
Exam 5: Extension D: Integrals5 Questions
Exam 5: Extension E: Integrals7 Questions
Exam 6: Extension A: Applications of Integration9 Questions
Exam 6: Extension B: Applications of Integration14 Questions
Exam 6: Extension C: Applications of Integration7 Questions
Exam 6: Extension D: Applications of Integration5 Questions
Exam 6: Extension E: Applications of Integration5 Questions
Exam 6: Extension F: Applications of Integration6 Questions
Exam 7: Extension A: Differential Equations11 Questions
Exam 7: Extension B: Differential Equations13 Questions
Exam 7: Extension C: Differential Equations5 Questions
Exam 7: Extension D: Differential Equations8 Questions
Exam 7: Extension E: Differential Equations7 Questions
Exam 7: Extension F: Differential Equations16 Questions
Exam 7: Extension G: Differential Equations10 Questions
Exam 8: Extension A: Infinte Sequences and Series6 Questions
Exam 8: Extension B: Infinte Sequences and Series11 Questions
Exam 8: Extension C: Infinte Sequences and Series7 Questions
Exam 8: Extension D: Infinte Sequences and Series5 Questions
Exam 8: Extension E: Infinte Sequences and Series6 Questions
Exam 8: Extension F: Infinte Sequences and Series5 Questions
Exam 8: Extension G: Infinte Sequences and Series8 Questions
Exam 8: Extension H: Infinte Sequences and Series5 Questions
Exam 9: Extension A: Vectors and the Geometry of Space5 Questions
Exam 9: Extension B: Vectors and the Geometry of Space5 Questions
Exam 9: Extension C: Vectors and the Geometry of Space5 Questions
Exam 9: Extension D: Vectors and the Geometry of Space6 Questions
Exam 9: Extension E: Vectors and the Geometry of Space9 Questions
Exam 10: Extension A: Vector Functions9 Questions
Exam 10: Extension B: Vector Functions5 Questions
Exam 10: Extension C: Vector Functions5 Questions
Exam 10: Extension D: Vector Functions7 Questions
Exam 10: Extension E: Vector Functions10 Questions
Exam 10: Extension F: Vector Functions4 Questions
Exam 10: Extension H: Vector Functions5 Questions
Exam 10: Extension G: Vector Functions9 Questions
Exam 10: Extension H: Vector Functions14 Questions
Exam 11: Extension A: Partial Derivatives5 Questions
Exam 11: Extension B: Partial Derivatives13 Questions
Exam 11: Extension C: Partial Derivatives17 Questions
Exam 11: Extension D: Partial Derivatives8 Questions
Exam 11: Extension E: Partial Derivatives5 Questions
Exam 11: Extension F: Partial Derivatives5 Questions
Exam 11: Extension G: Partial Derivatives14 Questions
Exam 11: Extension H: Partial Derivatives6 Questions
Exam 12: Extension A: Multiple Integrals5 Questions
Exam 12: Extension B: Multiple Integrals10 Questions
Exam 12: Extension C: Multiple Integrals11 Questions
Exam 12: Extension D: Multiple Integrals5 Questions
Exam 12: Extension E: Multiple Integrals11 Questions
Exam 12: Extension F: Multiple Integrals5 Questions
Exam 12: Extension G: Multiple Integrals6 Questions
Exam 12: Extension H: Multiple Integrals6 Questions
Exam 13: Extension A: Vector Calculus5 Questions
Exam 13: Extension B: Vector Calculus7 Questions
Exam 13: Extension C: Vector Calculus5 Questions
Exam 13: Extension D: Vector Calculus6 Questions
Exam 13: Extension E: Vector Calculus10 Questions
Exam 13: Extension F: Vector Calculus5 Questions
Exam 13: Extension G: Vector Calculus5 Questions
Exam 13: Extension H: Vector Calculus9 Questions
Exam 13: Extension I: Vector Calculus3 Questions
Select questions type
The velocity graph of a braking car is shown.Use it to estimate to the nearest foot the distance traveled by the car while the brakes are applied.Use a left sum with n = 7. 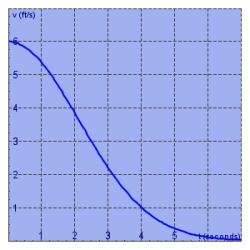
Free
(Short Answer)
4.9/5  (29)
(29)
Correct Answer: Verified
19
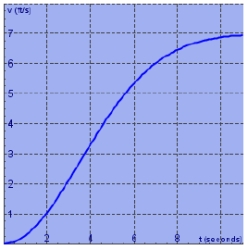
Determine a region whose area is equal to 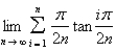
Free
(Multiple Choice)
4.9/5 (37)
Correct Answer:Verified
E
By reading values from the given graph of  ,use five rectangles to find a lower estimate,to the nearest whole number,for the area from 0 to 10 under the given graph of
Free
(Short Answer)
4.8/5 (28)
Correct Answer:Verified
21
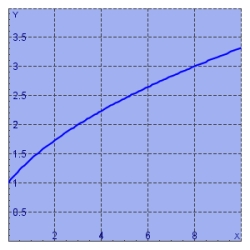
The velocity graph of a car accelerating from rest to a speed of 7 km/h over a period of 10 seconds is shown.Estimate to the nearest integer the distance traveled during this period.Use a right sum with 
(Short Answer)
4.9/5 (29)
The speed of a runner increased steadily during the first three seconds of a race.Her speed at half-second intervals is given in the table.Find a lower estimate for the distance that she traveled during these three seconds.
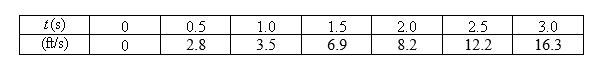
(Short Answer)
4.8/5 (33)
Filters
- Essay(0)
- Multiple Choice(0)
- Short Answer(0)
- True False(0)
- Matching(0)