Exam 7: Gdp and Cpi: Tracking the Macroeconomy
Exam 1: First Principles233 Questions
Exam 2: Economic Models319 Questions
Exam 3: Supply and Demand292 Questions
Exam 5: International Trade 5274 Questions
Exam 6: Macroeconomics: the Big Picture168 Questions
Exam 7: Gdp and Cpi: Tracking the Macroeconomy434 Questions
Exam 8: Unemployment and Inflation354 Questions
Exam 9: Long-Run Economic Growth316 Questions
Exam 10: Savings, Investment Spending, and the Financial System402 Questions
Exam 13: Fiscal Policy Appendix Taxes and the Multiplier382 Questions
Exam 14: Money, Banking, and the Federal Reserve System468 Questions
Exam 15: Monetary Policy359 Questions
Exam 16: Inflation, Disinflation, and Deflation240 Questions
Exam 17: Crises and Consequences214 Questions
Exam 18: Events and Ideas322 Questions
Exam 19: Open-Economy Macroeconomics467 Questions
Exam 20: Graphs in Economics75 Questions
Exam 21: toward a Fuller Understanding of Present Value36 Questions
Select questions type
Use the following to answer questions :
Figure: Circular-Flow Model 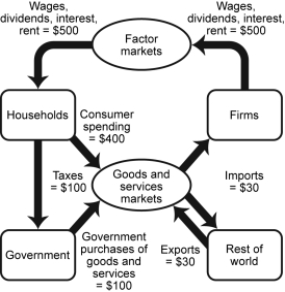 -(Figure: Circular-Flow Model) Look at the figure Circular-Flow Model. What are net exports?
(Multiple Choice)
4.9/5  (32)
(32)
Use the following to answer questions :
Figure: Circular-Flow Model
-(Figure: Circular-Flow Model) Look at the figure Circular-Flow Model. How does the government finance its purchases of goods and services?
(Multiple Choice)
4.9/5 (27)
Use the following to answer questions : 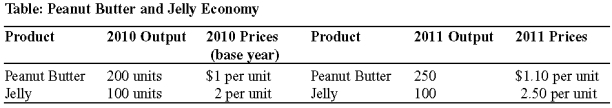 -(Table: Peanut Butter and Jelly Economy) Look at the table Peanut Butter and Jelly Economy. How much of the increase in nominal GDP between 2010 and 2011 was due to inflation?
(Multiple Choice)
4.7/5 (38)
If the consumer price index is 120 in year 1 and 150 in year 2, then the rate of inflation from year 1 to year 2 is:
(Multiple Choice)
4.9/5 (36)
Use the following to answer questions:
Figure: Expanded Circular-Flow Model 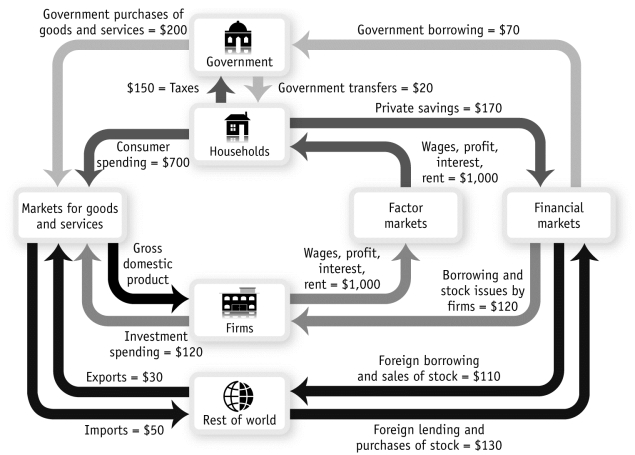 -(Figure: Expanded Circular-Flow Model) Look at the figure Expanded Circular-Flow Model. Which of the following is NOT a sector of the economy shown in the circular-flow model?
(Multiple Choice)
4.9/5 (38)
Use the following to answer questions :
Table: Peanut Butter and Jelly
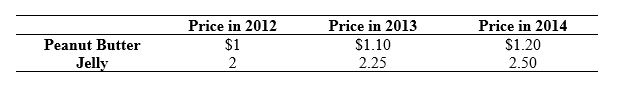 -(Table: Peanut Butter and Jelly) Look at the table Peanut Butter and Jelly. Suppose a market basket consists of 20 jars of peanut butter and 10 jars of jelly. If 2012 is the base year, what is the value of the price index in 2014?
(Multiple Choice)
4.9/5 (31)
Use the following to answer questions :
-(Table: Peanut Butter and Jelly Economy) Look at the table Peanut Butter and Jelly Economy. In 2011, nominal GDP was ____ and real GDP was _____.
(Multiple Choice)
4.8/5 (37)
Use the following to answer questions :
Table: Price and Output Data 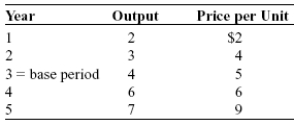 -(Table: Price and Output Data) Look at the table Price and Output Data. The price index for year 2 is:
(Multiple Choice)
4.9/5 (35)
Which of the following would accurately characterize the portion of a firm's profit paid to the owner of one share of its stock?
(Multiple Choice)
4.7/5 (43)
Use the following to answer questions : 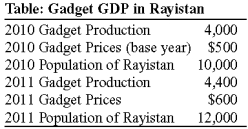 -(Table: Gadget GDP in Rayistan) Look at the table Gadget GDP in Rayistan. Why is real GDP per capita used as a measure of a country's standard of living? What are some of the limitations of using real GDP as the only measure of a country's quality of life?
(Essay)
4.8/5 (41)
Use the following to answer questions:
Table: Real and Nominal Output 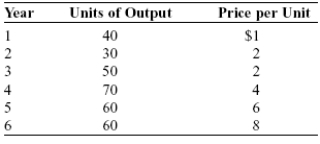 -(Table: Real and Nominal Output) Look at the table Real and Nominal Output. Assuming year 3 is the base year, real output in year 4 is:
(Multiple Choice)
4.8/5 (40)
Use the following to answer questions :
Table: Pizza Economy III
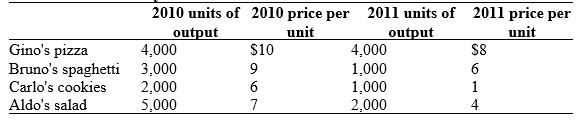 -(Table: Pizza Economy III) Look at the table Pizza Economy III. Using 2010 as the base year, nominal GDP in 2010 was:
(Multiple Choice)
4.9/5 (36)
The total income of households after taxes and government transfers is called:
(Multiple Choice)
4.8/5 (38)
Filters
- Essay(0)
- Multiple Choice(0)
- Short Answer(0)
- True False(0)
- Matching(0)