Exam 7: Gdp and Cpi: Tracking the Macroeconomy
Exam 1: First Principles233 Questions
Exam 2: Economic Models319 Questions
Exam 3: Supply and Demand292 Questions
Exam 5: International Trade 5274 Questions
Exam 6: Macroeconomics: the Big Picture168 Questions
Exam 7: Gdp and Cpi: Tracking the Macroeconomy434 Questions
Exam 8: Unemployment and Inflation354 Questions
Exam 9: Long-Run Economic Growth316 Questions
Exam 10: Savings, Investment Spending, and the Financial System402 Questions
Exam 13: Fiscal Policy Appendix Taxes and the Multiplier382 Questions
Exam 14: Money, Banking, and the Federal Reserve System468 Questions
Exam 15: Monetary Policy359 Questions
Exam 16: Inflation, Disinflation, and Deflation240 Questions
Exam 17: Crises and Consequences214 Questions
Exam 18: Events and Ideas322 Questions
Exam 19: Open-Economy Macroeconomics467 Questions
Exam 20: Graphs in Economics75 Questions
Exam 21: toward a Fuller Understanding of Present Value36 Questions
Select questions type
Use the following to answer questions :
Table: Peanut Butter and Jelly
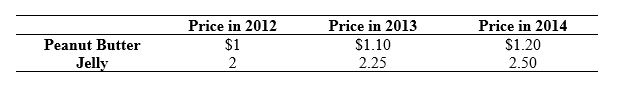 -(Table: Peanut Butter and Jelly) Look at the table Peanut Butter and Jelly. Suppose a market basket consists of 20 jars of peanut butter and 10 jars of jelly. What is the value of the market basket in 2014?
(Multiple Choice)
4.7/5  (32)
(32)
Chain linking is the method of calculating changes in real GDP using averages between an early base year and a late base year.
(True/False)
4.9/5 (38)
Consider an economy that produces only DVDs and DVD players. Last year, 10 DVDs were sold at $20 each and 5 DVD players were sold at $100 each, while this year 15 DVDs were sold at $10 each and 10 DVD players were sold at $50 each. Real GDP this year using last year as the base year is:
(Multiple Choice)
5.0/5 (43)
Use the following to answer questions : 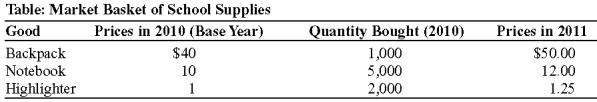 -(Table: Market Basket of School Supplies) Look at the table market Basket of School Supplies. It shows the prices of three common school supplies in 2010 and 2011 and the quantities of each school supply that consumers bought in 2010, the base year. A school supply index to measure the rate at which average school supply prices have changed would show an inflation rate of:
(Multiple Choice)
4.7/5 (40)
If the price level and nominal GDP both doubled, then real GDP would:
(Multiple Choice)
4.8/5 (33)
Of the following items, which would NOT be included in GDP?
(Multiple Choice)
4.7/5 (31)
Suppose the consumer price index was 180.5 last year and this year is 202.2. What is the rate of inflation between last year and this year? What is the rate of inflation between the base year and this year?
(Essay)
4.9/5 (43)
The market(s) that channel the excess savings of households into investment spending by firms is(are):
(Multiple Choice)
5.0/5 (29)
Use the following to answer questions : 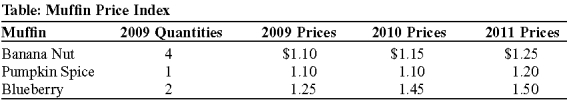 -(Table: Muffin Price Index) Look at the table Muffin Price Index. A college town has many small coffee shops, and they all sell muffins. As an economics project you have been assigned to compile a muffin price index (MPI). The base year is 2009. Use these data to compute the rate of inflation in the MPI between:
a. 2009 and 2010.
b. 2008 and 2011.
-(Table: Muffin Price Index) Look at the table Muffin Price Index. A college town has many small coffee shops, and they all sell muffins. As an economics project you have been assigned to compile a muffin price index (MPI). The base year is 2009. Use these data to compute the rate of inflation in the MPI between:
a. 2009 and 2010.
b. 2008 and 2011.
(Essay)
4.8/5 (36)
Use the following to answer questions:
Scenario: Real GDP
Suppose that in year 1 an economy produces 100 golf balls that sell for $3 each and 75 pizzas that sell for $8 each. The next year the economy produces 110 golf balls that sell for $3.25 each and 80 pizzas that sell for $9 each.
-(Scenario: Real GDP) Look at the scenario Real GDP. Using year 1 as the base year, the growth rate of real GDP from year 1 to year 2 is:
(Multiple Choice)
4.9/5 (33)
Use the following to answer questions :
Table: Price and Output Data 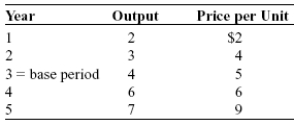 -(Table: Price and Output Data) Look at the table Price and Output Data. Between years 4 and 5, _____ of the increase in nominal GDP was due to inflation.
(Multiple Choice)
4.9/5 (39)
Domestically produced goods and services sold to people in other countries are known as:
(Multiple Choice)
4.8/5 (40)
Use the following to answer questions:
Figure: Expanded Circular-Flow Model 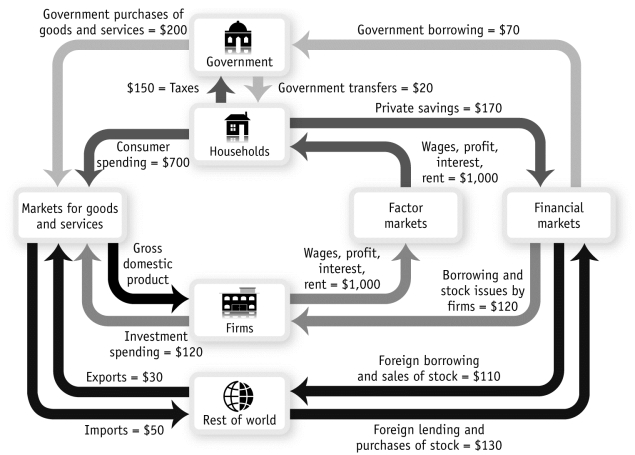 -(Figure: Expanded Circular-Flow Model) Look at the figure Expanded Circular-Flow Model. The total flow of funds into and out of households is:
(Multiple Choice)
4.7/5 (39)
Use the following to answer questions :
Table: Price and Output Data
-(Table: Price and Output Data) Look at the table Price and Output Data. Between years 2 and 3, real GDP increased by:
(Multiple Choice)
4.8/5 (39)
Overcounting in the GDP can be avoided by including both final and intermediate production.
(True/False)
4.9/5 (38)
Filters
- Essay(0)
- Multiple Choice(0)
- Short Answer(0)
- True False(0)
- Matching(0)