Exam 19: Graphs in Economics
Exam 1: First Principles198 Questions
Exam 2: Economic Models: Trade-Offs and Trade296 Questions
Exam 3: Supply and Demand264 Questions
Exam 4: Price Controls and Quotas: Meddling With Markets200 Questions
Exam 5: International Trade258 Questions
Exam 6: Macroeconomics: the Big Picture153 Questions
Exam 7: Gdp and the Cpi: Tracking the Macroeconomy321 Questions
Exam 8: Unemployment and Inflation332 Questions
Exam 9: Long-Run Economic Growth298 Questions
Exam 10: Savings, Investment Spending, and the Financial System385 Questions
Exam 11: Income and Expenditure130 Questions
Exam 12: Aggregate Demand and Aggregate Supply345 Questions
Exam 13: Fiscal Policy346 Questions
Exam 14: Money, Banking, and the Federal Reserve System428 Questions
Exam 15: Monetary Policy340 Questions
Exam 16: Inflation, Disinflation, and Deflation221 Questions
Exam 17: Macroeconomics: Events and Ideas309 Questions
Exam 18: International Macroeconomics441 Questions
Exam 19: Graphs in Economics60 Questions
Select questions type
Use the following to answer questions: 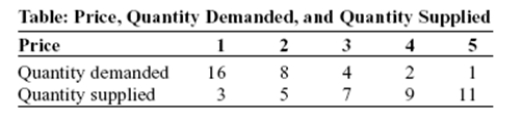 -(Table: Price,Quantity Demanded,and Quantity Supplied)Use Table: Price,Quantity Demanded,and Quantity Supplied.The slope of the line representing the relation between price on the vertical axis and quantity supplied on the horizontal axis is:
Free
(Multiple Choice)
4.8/5  (44)
(44)
Correct Answer: Verified
A
Use the following to answer questions: 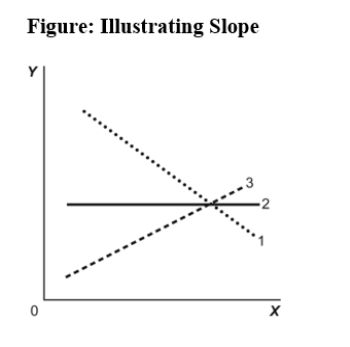 -(Figure: Illustrating Slope)Use Figure: Illustrating Slope.In the graph,line 1 depicts X and Y to be:
Free
(Multiple Choice)
4.9/5 (34)
Correct Answer:Verified
D
On a two-dimensional graph representing two variables:
Free
(Multiple Choice)
4.9/5 (31)
Correct Answer:Verified
C
Use the following to answer questions:
-(Table: Price,Quantity Demanded,and Quantity Supplied)Use Table: Price,Quantity Demanded,and Quantity Supplied.A linear relationship exists between:
(Multiple Choice)
4.9/5 (46)
Use the following to answer questions: 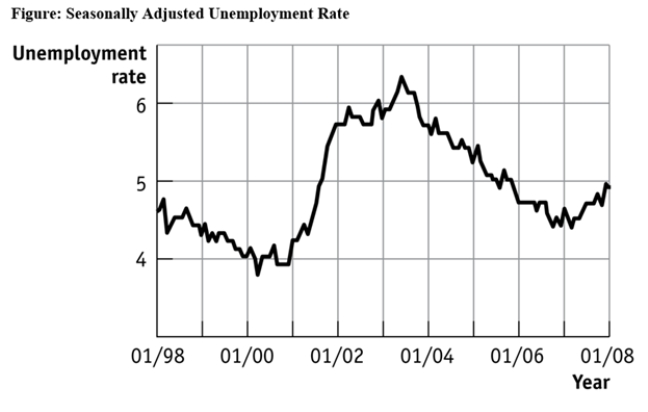 -(Figure: Seasonally Adjusted Unemployment Rate)Use Figure: Seasonally Adjusted Unemployment Rate.The distance between each labeled point on the horizontal axis is 1 year,and the distance between each labeled point on the vertical axis is 1 percentage point of unemployment.What is the approximate slope of the graph between 1/2004 and 1/2006 (using percentage point and years as the units on the vertical and horizontal axes,respectively)?
(Multiple Choice)
4.7/5 (34)
A positive relationship between swimsuits purchased and ice cream purchased could be the result of:
(Multiple Choice)
4.8/5 (37)
Use the following to answer questions: 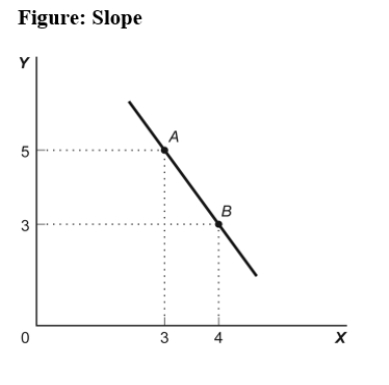 -(Figure: Slope)Use Figure: Slope.The slope of the line in the graph can be calculated by:
(Multiple Choice)
4.8/5 (42)
Use the following to answer questions:
-(Table: Price,Quantity Demanded,and Quantity Supplied)Use Table: Price,Quantity Demanded,and Quantity Supplied.The slope of the line representing the relationship between price on the vertical axis and quantity demanded on the horizontal axis is:
(Multiple Choice)
4.7/5 (35)
Use the following to answer questions: 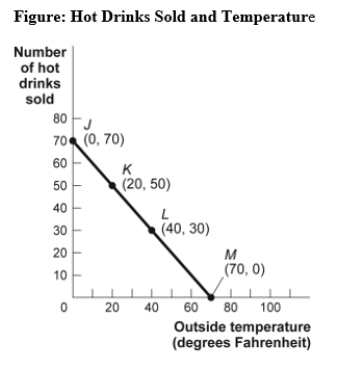 -(Figure: Hot Drinks Sold and Temperature)Use Figure: Hot Drinks Sold and Temperature.If we move from point J to point L in the figure,the outside temperature has _____ degrees and the number of hot drinks sold has _____.
(Multiple Choice)
4.8/5 (32)
Taylor sees a bar graph showing the average weight of adult males over the past 200 years and concludes that men get more obese over time.Taylor's conclusion may be wrong since she did not consider:
(Multiple Choice)
4.8/5 (38)
Use the following to answer questions: 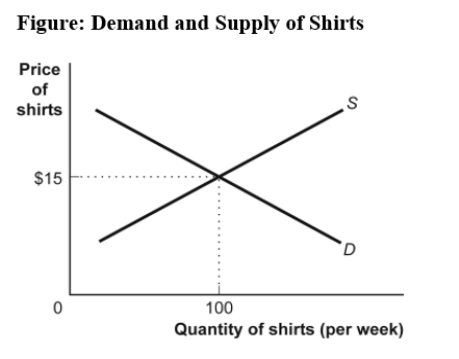 -(Figure: Demand and Supply of Shirts)Use Figure Demand and Supply of Shirts.If the line labeled S shows how many shirts per week will be offered for sale at various prices,then it is clear that,for supply,quantity and price are:
(Multiple Choice)
4.9/5 (32)
Use the following to answer questions:
-(Figure: Hot Drinks Sold and Temperature)Use Figure: Hot Drinks Sold and Temperature.If we move from point L to point M in the figure,the outside temperature has _____ degrees and the number of hot drinks sold has _____.
(Multiple Choice)
4.9/5 (46)
Use the following to answer questions: 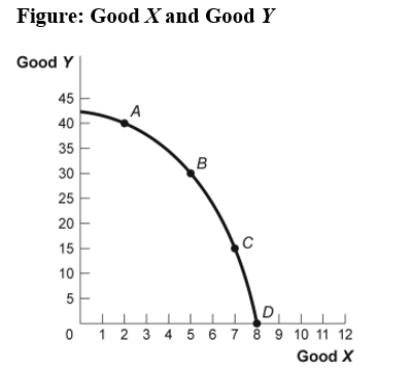 -(Figure: Good X and Good Y)Use Figure: Good X and Good Y.If we move from point B to point C in the figure,the x-variable has _____ units and the y-variable has _____ units.
(Multiple Choice)
4.9/5 (41)
Use the following to answer questions:
-(Figure: Seasonally Adjusted Unemployment Rate)Use Figure: Seasonally Adjusted Unemployment Rate.The distance between each labeled point on the horizontal axis is 1 year,and the distance between each labeled point on the vertical axis is 1 percentage point of unemployment.Unemployment was _____ between 1/2001 and 1/2003 and _____ between 1/2007 and 1/2008.
(Multiple Choice)
4.9/5 (37)
If two variables are positively related,on a graph they will always be represented by a:
(Multiple Choice)
4.8/5 (33)
In looking at a chart of the positive relationship between police officers and crime,the mayor remarks that more police officers cause more crime.The mayor may be wrong because she did not consider:
(Multiple Choice)
4.8/5 (36)
Use the following to answer questions: 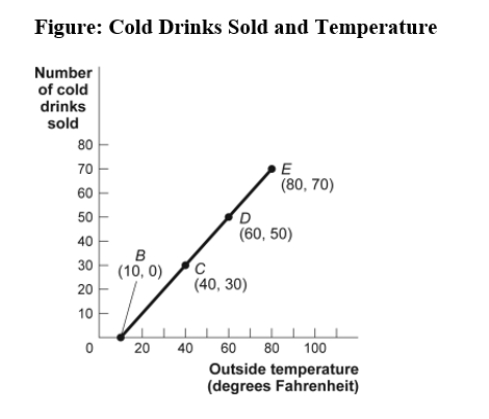 -(Figure: Cold Drinks Sold and Temperature)Use Figure: Cold Drinks Sold and Temperature.If we move from point B to point C in the figure,the outside temperature has _____ degrees and the number of cold drinks sold has _____.
(Multiple Choice)
4.8/5 (35)
Use the following to answer question 43: 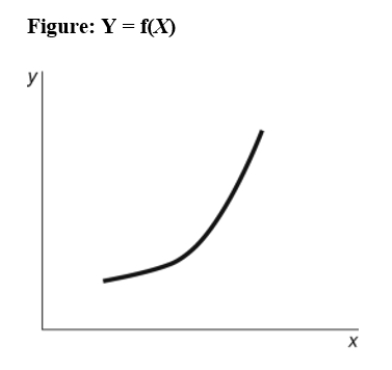 -(Figure: y = f(x))Use Figure: y = f(x).The slope of the relation between x and y is:
(Multiple Choice)
4.8/5 (35)
Filters
- Essay(0)
- Multiple Choice(0)
- Short Answer(0)
- True False(0)
- Matching(0)