Exam 8: Correlational Research
Exam 1: Introduction to Educational Research57 Questions
Exam 2: Selecting and Defining a Research Topic33 Questions
Exam 3: Reviewing the Literature30 Questions
Exam 4: Preparing and Evaluating a Research Plan27 Questions
Exam 5: Selecting a Sample42 Questions
Exam 6: Selecting Measurement Instruments60 Questions
Exam 7: Survey Research38 Questions
Exam 8: Correlational Research50 Questions
Exam 9: Causal-Comparative Research44 Questions
Exam 10: Experimental Research67 Questions
Exam 11: Single-Subject Experimental Research34 Questions
Exam 12: Narrative Research38 Questions
Exam 13: Ethnographic Research48 Questions
Exam 14: Case Study Research25 Questions
Exam 15: Mixed Methods Research38 Questions
Exam 16: Action Research41 Questions
Exam 17: Descriptive Statistics73 Questions
Exam 18: Inferential Statistics52 Questions
Exam 19: Qualitative Data Collection49 Questions
Exam 20: Qualitative Data Analysis and Interpretation37 Questions
Exam 21: Preparing a Research Report41 Questions
Exam 22: Evaluating a Research Report49 Questions
Select questions type
A strong negative correlation coefficient indicates that
Free
(Multiple Choice)
4.8/5  (37)
(37)
Correct Answer: Verified
B
The common variance shared by the predictor and criterion variables is referred to as the
Free
(Multiple Choice)
4.8/5 (31)
Correct Answer:Verified
A
In a single prediction question (Y=a + bX), Y represents a(n)
Free
(Multiple Choice)
4.7/5 (40)
Correct Answer:Verified
A
Given a correlation of r = .60, the common variance shared by the variables is
(Multiple Choice)
4.9/5 (33)
In a single prediction question (Y=a + bX), X represents a(n)
(Multiple Choice)
4.9/5 (26)
A correlation between reading and math achievement scores on a national standardized test for first graders indicates a correlation of r = .90. How much variance do these scores share?
(Multiple Choice)
4.8/5 (26)
According to your text, the fewest number of participants required for a correlation study is
(Multiple Choice)
4.9/5 (34)
Sam concluded in his research report that as class size increased teaching efficacy also increased. Of the following which is a correlation coefficient would best support Sam's claim.
(Multiple Choice)
5.0/5 (42)
A Pearson r correlation is best used for data that is expressed as
(Multiple Choice)
4.8/5 (33)
Of the following research topics, which is most likely to represent a prediction study?
(Multiple Choice)
4.9/5 (43)
Kevin's analysis indicated that in his dataset SES was correlated r = .25 with absenteeism. This indicates that
(Multiple Choice)
4.8/5 (30)
Given the graph below what is the most likely correlation between these variables? 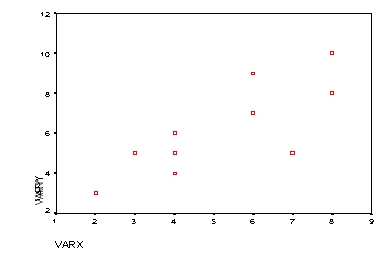
(Multiple Choice)
4.9/5 (37)
Monica, on the other hand, reported a correlation of 3.4 between community service and interest in helping professions among adolescents. This finding suggests that
(Multiple Choice)
4.8/5 (34)
Duffy's research addresses the relationships among amount of practice time, race times, and motivation for running in high school athletes. He measures motivation for running by a Likert scale. Given Duffy's research, which one of the following correlation coefficients should he use to analyze his data?
(Multiple Choice)
4.9/5 (27)
Joe uses age, family size, and income to predict scores on a survey of happiness. The results were statistically significant with a coefficient of determination of 64%. He collects a new sample and examines the regression equation. In Joe's second sample, the common variance will likely __________ due to __________.
(Multiple Choice)
4.7/5 (40)
Gretchen wanted to see whether, given a sample of teachers' that graduated from colleges and Universities, GPA in college was related to starting salary as a teacher. Which correlation coefficient should Gretchen calculate?
(Multiple Choice)
4.7/5 (38)
When using correlational analysis with multiple predictors and multiple criterion variables, the appropriate procedure is
(Multiple Choice)
4.8/5 (34)
In a prediction study of low achieving students academic motivation, Hillary was surprised that achievement scores were not a significant predictor of motivation. Hillary's analysis is most likely is displaying
(Multiple Choice)
4.8/5 (32)
Filters
- Essay(0)
- Multiple Choice(0)
- Short Answer(0)
- True False(0)
- Matching(0)