Exam 1: The Scope and Method of Economics
Exam 1: The Scope and Method of Economics120 Questions
Exam 2: The Economic Problem: Scarcity and Choice110 Questions
Exam 3: Demand, Supply, and Market Equilibrium144 Questions
Exam 4: Demand and Supply Applications86 Questions
Exam 5: Elasticity86 Questions
Exam 6: Household Behavior and Consumer Choice137 Questions
Exam 7: The Production Process: the Behavior of Profit-Maximizing Firms144 Questions
Exam 8: Short-Run Costs and Output Decisions196 Questions
Exam 9: Long-Run Costs and Output Decisions187 Questions
Exam 10: Input Demand: the Labor and Land Markets123 Questions
Exam 11: Input Demand: the Capital Market and the Investment Decision116 Questions
Exam 12: General Equilibrium and the Efficiency of Perfect Competition99 Questions
Exam 13: Monopoly and Antitrust Policy200 Questions
Exam 14: Oligopoly110 Questions
Exam 15: Monopolistic Competition118 Questions
Exam 16: Externalities, Public Goods, and Social Choice170 Questions
Exam 17: Uncertainty and Asymmetric Information66 Questions
Exam 18: Income Distribution and Poverty143 Questions
Exam 19: Public Finance: The Economics of Taxation136 Questions
Exam 20: International Trade, Comparative Advantage, and Protectionism151 Questions
Exam 21: Economic Growth in Developing and Transitional Economies105 Questions
Select questions type
Refer to the information provided in Figure 1.1 below to answer the questions that follow. 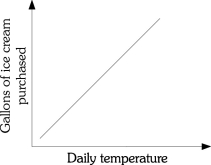 Figure 1.1
-Refer to Figure 1.1. There is ________ relationship between the daily temperature and the number of gallons of ice cream purchased.
Figure 1.1
-Refer to Figure 1.1. There is ________ relationship between the daily temperature and the number of gallons of ice cream purchased.
(Multiple Choice)
4.8/5  (37)
(37)
The four criteria that are frequently used in judging the outcome of economic policy are
(Multiple Choice)
4.9/5 (38)
Refer to the information provided in Figure 1.3 below to answer the questions that follow. 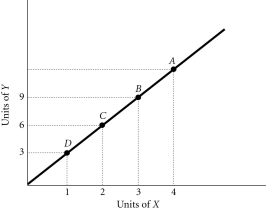 Figure 1.3
-Refer to Figure 1.3. At Point A the slope of the line is 3, so at Point D the slope would be
Figure 1.3
-Refer to Figure 1.3. At Point A the slope of the line is 3, so at Point D the slope would be
(Multiple Choice)
4.7/5 (36)
Related to the Economics in Practice on page 10: Prior to joining a fraternity, James spent most of his evenings and weekends studying for his classes. Once he joined the fraternity, James spent a majority of his evenings and weekends going to parties. This change in behavior is best described by
(Multiple Choice)
4.8/5 (36)
The slope of a straight line is not constant unless the line is vertical or horizontal.
(True/False)
4.8/5 (39)
Redistribution of income from the rich to the poor is achieved from a tax system that requires taxes to rise with income. Which of the following criteria best explains the goal of this tax system?
(Multiple Choice)
4.8/5 (41)
If you observe that Event A happens before Event B happens, and you conclude that Event A caused Event B, you would be guilty of an error called the
(Multiple Choice)
4.8/5 (36)
You have decided that you want to attend a costume party as Iron Man. You estimate that it will cost $40 to assemble your costume. After spending $40 on the costume, you realize that the additional pieces you need will cost you $25 more. The marginal cost of completing the costume is
(Multiple Choice)
4.8/5 (32)
Refer to Scenario 1.1 below to answer the questions that follow.
SCENARIO 1.1: An economist wants to understand the relationship between minimum wages and the level of teenage unemployment. The economist collects data on the values of the minimum wage and the levels of teenage unemployment over time. The economist concludes that a 1% increase in minimum wage causes a 0.2% increase in teenage unemployment. From this information he concludes that the minimum wage is harmful to teenagers and should be reduced or eliminated to increase employment among teenagers.
-Refer to Scenario 1.1. The statement that an increase in the minimum wage causes an increase in teenage unemployment is an example of
(Multiple Choice)
5.0/5 (28)
Which of the following is NOT one of the three fundamental concepts of economics?
(Multiple Choice)
4.9/5 (28)
Refer to the information provided in Figure 1.5 below to answer the questions that follow. 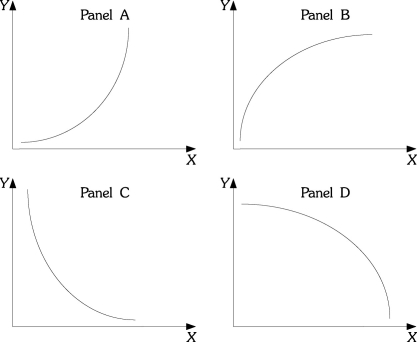 Figure 1.5
-Refer to Figure 1.5. In many industries, as firms produce additional units, average costs of production decline as the firm produces an additional unit, but average costs declines by a smaller and smaller amount as production continues to increase. If output is graphed on the horizontal axis and average costs are graphed on the vertical axis, the relationship between average costs and output would be like which of the following panels?
Figure 1.5
-Refer to Figure 1.5. In many industries, as firms produce additional units, average costs of production decline as the firm produces an additional unit, but average costs declines by a smaller and smaller amount as production continues to increase. If output is graphed on the horizontal axis and average costs are graphed on the vertical axis, the relationship between average costs and output would be like which of the following panels?
(Multiple Choice)
4.9/5 (38)
If your tuition is $25,000 this semester, your books cost $1,500, you can only work 20 rather than 40 hours per week during the 15 weeks you are taking classes and you make $15 per hour, and your room and board is $7,500 this semester (same as if not attending college), then your opportunity cost of attending college this semester is
(Multiple Choice)
4.7/5 (42)
Economists use the phrase ceteris paribus to express the assumption
(Multiple Choice)
4.9/5 (42)
Refer to the information provided in Figure 1.4 below to answer the questions that follow. 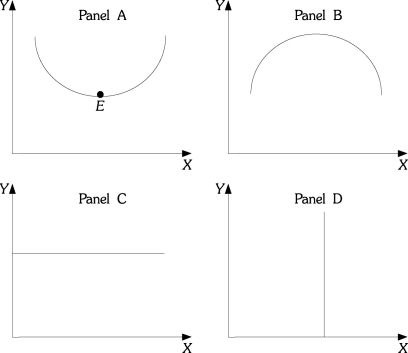 Figure 1.4
-Refer to Figure 1.4. At Point E in panel A, the slope is
Figure 1.4
-Refer to Figure 1.4. At Point E in panel A, the slope is
(Multiple Choice)
4.7/5 (32)
Filters
- Essay(0)
- Multiple Choice(0)
- Short Answer(0)
- True False(0)
- Matching(0)