Exam 18: Cost Behavior and Cost-Volume-Profit Analysis
Exam 1: Introducing Accounting in Business262 Questions
Exam 2: Analyzing and Recording Transactions213 Questions
Exam 3: Adjusting Accounts and Preparing Financial Statements230 Questions
Exam 4: Accounting for Merchandising Operations195 Questions
Exam 5: Inventories and Cost of Sales199 Questions
Exam 6: Cash and Internal Controls197 Questions
Exam 7: Accounts and Notes Receivable163 Questions
Exam 8: Long-Term Assets202 Questions
Exam 9: Current Liabilities184 Questions
Exam 10: Long-Term Liabilities185 Questions
Exam 11: Corporate Reporting and Analysis209 Questions
Exam 12: Reporting and Analyzing Cash Flows172 Questions
Exam 13: Analyzing Financial Statements184 Questions
Exam 14: Managerial Accounting Concepts and Principles202 Questions
Exam 15: Job Order Costing and Analysis153 Questions
Exam 16: Process Costing and Analysis185 Questions
Exam 17: Activity-Based Costing and Analysis173 Questions
Exam 18: Cost Behavior and Cost-Volume-Profit Analysis177 Questions
Exam 19: Variable Costing and Performance Reporting175 Questions
Exam 20: Master Budgets and Performance Planning158 Questions
Exam 21: Flexible Budgets and Standard Costing177 Questions
Exam 22: Decentralization and Performance Evaluation128 Questions
Exam 23: Relevant Costing for Managerial Decisions136 Questions
Exam 24: Capital Budgeting and Investment Analysis139 Questions
Exam 25: Investments and International Operations168 Questions
Exam 26: Accounting for Partnerships126 Questions
Exam 27 Appendix : Accounting With Special Journals153 Questions
Select questions type
Describe how a cost-volume-profit analysis would be performed for a company that sells more than one product. (Assume that the sales mix is known.)
(Essay)
4.8/5  (40)
(40)
A product sells for $200 per unit, and its variable costs per unit are $130. The fixed costs are $420,000. If the firm wants to earn $35,000 pretax income, how many units must be sold?
(Multiple Choice)
4.9/5 (40)
What is operating leverage? How can the degree of operating leverage be used in analyzing changes in sales?
(Essay)
4.9/5 (36)
Dividing a mixed cost into its separate fixed and variable cost components makes it more difficult to do cost-volume-profit analysis.
(True/False)
4.8/5 (32)
Ginger Company's product has a contribution margin per unit of $11.25 and a contribution margin ratio of 22.5%. What is the selling price of the product?
(Multiple Choice)
4.7/5 (36)
A step-wise variable cost can be separated into a fixed component and a variable component.
(True/False)
4.9/5 (26)
Brown Company's contribution margin ratio is 24%. Total fixed costs are $84,000. What is Brown's break-even point in sales dollars?
(Multiple Choice)
4.9/5 (40)
The contribution margin per unit is equal to the sales price per unit minus the variable costs per unit.
(True/False)
4.8/5 (41)
A company has a contribution margin per unit of $8.25 and a contribution margin ratio of 12%. What is the selling price of the product?
(Multiple Choice)
4.8/5 (38)
Davison Company has fixed costs of $315,000 and a contribution margin ratio of 24%. If sales are expected to be $1,500,000, what is the margin of safety in percent?
(Essay)
4.8/5 (43)
Scatter diagrams plot volume on the vertical axis and cost on the horizontal axis.
(True/False)
4.8/5 (36)
Variable costs per unit increase proportionately with increases in output activity.
(True/False)
4.8/5 (35)
A product has a contribution margin per unit of $17 and sells at $25 per unit. If the break-even point is 82,000 units, calculate (a) the variable costs per unit and (b) the total fixed costs.
(Essay)
4.9/5 (32)
Willco Inc. manufactures electronic parts. They are analyzing their monthly maintenance costs to determine the best way to budget these costs in the future. They have collected the following data for the last 6 months:
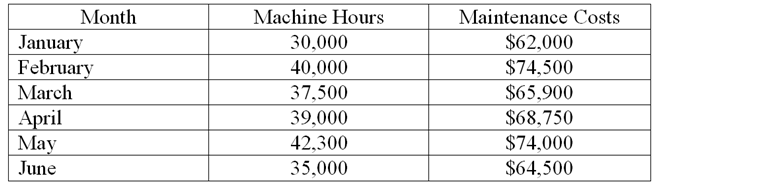 -Using the high-low method and the Willco data above, what is the approximate fixed cost component of the monthly maintenance costs?
(Multiple Choice)
4.9/5 (33)
To determine the slope of the variable cost from a scatter diagram, divide the change in volume by the change in cost.
(True/False)
4.8/5 (48)
___________________________ is a statistical method of identifying an estimated line of cost behavior.
(Short Answer)
4.9/5 (42)
Filters
- Essay(0)
- Multiple Choice(0)
- Short Answer(0)
- True False(0)
- Matching(0)