Exam 18: Cost Behavior and Cost-Volume-Profit Analysis
Exam 1: Introducing Accounting in Business262 Questions
Exam 2: Analyzing and Recording Transactions213 Questions
Exam 3: Adjusting Accounts and Preparing Financial Statements230 Questions
Exam 4: Accounting for Merchandising Operations195 Questions
Exam 5: Inventories and Cost of Sales199 Questions
Exam 6: Cash and Internal Controls197 Questions
Exam 7: Accounts and Notes Receivable163 Questions
Exam 8: Long-Term Assets202 Questions
Exam 9: Current Liabilities184 Questions
Exam 10: Long-Term Liabilities185 Questions
Exam 11: Corporate Reporting and Analysis209 Questions
Exam 12: Reporting and Analyzing Cash Flows172 Questions
Exam 13: Analyzing Financial Statements184 Questions
Exam 14: Managerial Accounting Concepts and Principles202 Questions
Exam 15: Job Order Costing and Analysis153 Questions
Exam 16: Process Costing and Analysis185 Questions
Exam 17: Activity-Based Costing and Analysis173 Questions
Exam 18: Cost Behavior and Cost-Volume-Profit Analysis177 Questions
Exam 19: Variable Costing and Performance Reporting175 Questions
Exam 20: Master Budgets and Performance Planning158 Questions
Exam 21: Flexible Budgets and Standard Costing177 Questions
Exam 22: Decentralization and Performance Evaluation128 Questions
Exam 23: Relevant Costing for Managerial Decisions136 Questions
Exam 24: Capital Budgeting and Investment Analysis139 Questions
Exam 25: Investments and International Operations168 Questions
Exam 26: Accounting for Partnerships126 Questions
Exam 27 Appendix : Accounting With Special Journals153 Questions
Select questions type
A product is sold for $45 and has variable costs of $33 per unit. The total fixed costs for the firm are $180,600. If the firm desires to earn a pretax income of $77,400, how many units must be sold?
(Essay)
4.9/5  (35)
(35)
A visual inspection of a scatter diagram may be used to identify the approximate relation between past cost and volume.
(True/False)
4.9/5 (35)
A company manufactures a product and sells it for $120 per unit. The total fixed costs of manufacturing and selling the product are expected to be $155,250, and the variable costs are expected to be $75 per unit. What is the company's break-even point in (a) units and (b) dollar sales?
(Essay)
4.9/5 (35)
As the level of output activity increases, fixed cost per unit remains constant.
(True/False)
4.9/5 (41)
__________________ is the amount by which the unit selling price of a product exceeds its per unit variable cost.
(Short Answer)
4.7/5 (37)
Boston Co. is considering the production and sale of a new product with the following sales and cost data: unit sales price, $300; unit variable costs, $180; total fixed costs, $270,000; and projected sales, $900,000. What is the margin of safety:
(a) In dollar sales?
(b) As a percent of sales?
(Essay)
4.8/5 (51)
Tanner Inc. has incurred the following overhead costs over a 6 week period:
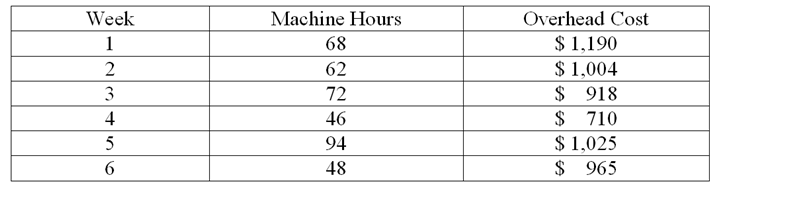 -Calculate the approximate fixed cost component of Tanner's overhead costs using the high-low method.
(Multiple Choice)
4.7/5 (47)
Degree of operating leverage (DOL) is defined as total contribution margin in dollars divided by pretax income.
(True/False)
4.8/5 (39)
Tanner Inc. has incurred the following overhead costs over a 6 week period:
-Using the high-low method, calculate the variable cost component of these overhead costs (round to the nearest two decimal places).
(Multiple Choice)
4.7/5 (30)
A company wishes to earn a pretax income equal to 35% of total fixed costs. Its product sells for $50.75 per unit. Total fixed costs equal $156,800 and variable costs per unit are $32.50. How many units must this company sell to meet its goal? (Round answer to complete units.)
(Multiple Choice)
4.9/5 (40)
The difference between sales price per unit and variable cost per unit is the:
(Multiple Choice)
4.7/5 (41)
A firm sells two products, A and B. For every unit of A the firm sells, two units of B are sold. The firm's total fixed costs are $1,612,000. Selling prices and cost information for both products follow:
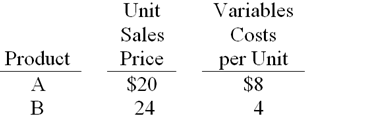 -The weighted average contribution margin is:
(Multiple Choice)
4.8/5 (38)
Unit contribution ratio is calculated by dividing sales price per unit by the unit contribution margin.
(True/False)
4.9/5 (39)
A graphic depiction of the break-even point is known as a cost-volume-profit (CVP) chart.
(True/False)
4.8/5 (31)
The ratio of the volumes of the various products sold by a company is called the ______________________________.
(Short Answer)
4.8/5 (33)
Mueller Corp. manufactures compact discs that sell for $5.00. Fixed costs are $28,000 and variable costs are $3.60 per unit. Mueller can buy a newer production machine that will increase fixed costs by $8,000 per year, but will decrease variable costs by $0.40 per unit. What effect would the purchase of the new machine have on Mueller's break-even point in units?
(Multiple Choice)
5.0/5 (41)
A cost-volume-profit (CVP) chart is a graph that plots volume on the horizontal axis and costs and sales on the vertical axis.
(True/False)
4.9/5 (40)
A firm produces and sells a product with a contribution margin of $32 per unit. The firm is presently selling 90,000 units and earning $240,000 in after-tax income. Taxes are $80,000 at a 25% tax rate. If the firm desires to increase its after-tax income to $300,000, how many more units must it sell?
(Essay)
4.8/5 (45)
Filters
- Essay(0)
- Multiple Choice(0)
- Short Answer(0)
- True False(0)
- Matching(0)