Exam 9: Working With Trendlines, Pivot Table Reports, Pivotchart Reports, and Slicers
Exam 1: Essential Concepts and Skills112 Questions
Exam 2: Creating a Worksheet and a Chart112 Questions
Exam 3: Formulas, Functions, and Formatting111 Questions
Exam 4: Working With Large Worksheets, Charting, and What-If Analysis112 Questions
Exam 5: Working With Multiple Worksheets and Workbooks112 Questions
Exam 6: Financial Functions, Data Tables, and Amortization Schedules111 Questions
Exam 7: Creating, Sorting, and Querying a Table112 Questions
Exam 8: Creating Templates, Manipulating Data, and Adding Additional Enhancements to a Worksheet112 Questions
Exam 9: Working With Trendlines, Pivot Table Reports, Pivotchart Reports, and Slicers112 Questions
Exam 10: Formula Auditing, Data Validation, and Complex Problem Solving112 Questions
Exam 11: Using Macros and Visual Basic for Applications Vba With Excel112 Questions
Exam 12: Collaboration Features for Workbooks112 Questions
Select questions type
_________________________ can represent changes in one set of data with changes in another set of data.
(Short Answer)
4.8/5  (35)
(35)
The Field Headers button is located in the _________________________ group on the PIVOTTABLE TOOLS ANALYZE tab.
(Short Answer)
4.8/5 (30)
When creating a PivotChart report, you select the chart type and subtype in the __________________________ dialog box.
(Short Answer)
4.8/5 (34)
You can add a trendline to all of the following EXCEPT a(n) ____ chart.
(Multiple Choice)
4.8/5 (33)
Today, data are increasingly available from a wide variety of sources and gathered with much more ease.
(True/False)
4.8/5 (34)
MATCHING
Identify the letter of the choice that best matches the phrase or definition.
-Changes to category fields are correspondingly made to these in the PivotTable report.
(Multiple Choice)
4.8/5 (27)
Which of the following is the path to the +/- Buttons button?
(Multiple Choice)
4.8/5 (30)
When a field of interest is already part of the PivotTable, included in the ROWS area of the PivotTable Fields task pane, you can use filters associated with those fields in the PivotTable report, _________________________ filters, to view a subset of data.
(Short Answer)
4.8/5 (40)
In a PivotTable, ____ fields correspond to summary values of original data across categories.
(Multiple Choice)
4.8/5 (30)
Which of the following is the path to the 'Add Chart Element' button?
(Multiple Choice)
4.9/5 (42)
Which are types of fields used by PivotTables?
a.
summary
b.
data
c.
category
d.
index
(Short Answer)
4.8/5 (32)
Before you add a trendline to a chart, you need to determine the data series to analyze.
(True/False)
4.9/5 (37)
MATCHING
Identify the letter of the choice that best matches the phrase or definition.
-Graphic objects used to filter data.
(Multiple Choice)
4.8/5 (29)
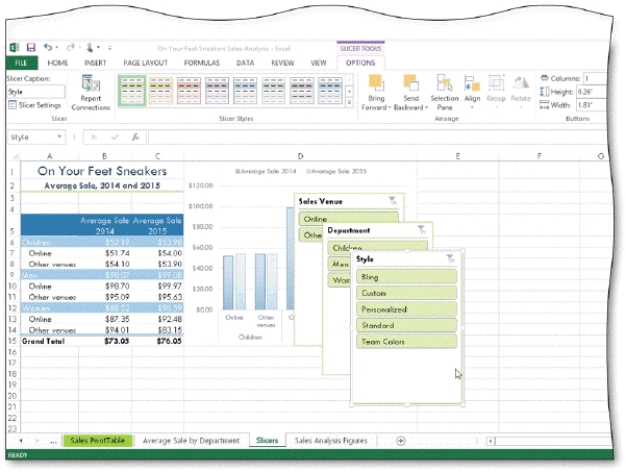 -As shown in the accompanying figure, _________________________ are graphic objects that contain buttons you tap or click to filter the data in PivotTables and PivotCharts.
(Short Answer)
5.0/5 (32)
The summary function that calculates the number of data values in a PivotTable report is ____.
(Multiple Choice)
4.9/5 (32)
Excel needs the blank rows above a PivotTable to remain blank, for any filters added in the PivotTable Fields task pane.
(True/False)
4.8/5 (37)
Filters
- Essay(0)
- Multiple Choice(0)
- Short Answer(0)
- True False(0)
- Matching(0)