Exam 10: Baggregate Expenditure and Aggregate Demand
Exam 1: The Art and Science of Economic Analysis162 Questions
Exam 2: Economic Tools and Economics Systems198 Questions
Exam 3: Economic Decision Makers207 Questions
Exam 4: Demand, supply, and Markets239 Questions
Exam 5: Introduction to Macroeconomics165 Questions
Exam 6: Tracking the Useconomy206 Questions
Exam 7: Unemployment and Inflation208 Questions
Exam 8: Productivity and Growth123 Questions
Exam 9: Aaggregate Expenditure and Aggregate Demand169 Questions
Exam 10: Baggregate Expenditure and Aggregate Demand144 Questions
Exam 11: Aggregate Supply211 Questions
Exam 12: Fiscal Policy169 Questions
Exam 13: Federal Budgets and Public Policy161 Questions
Exam 14: Money and the Financial System212 Questions
Exam 15: Banking and the Money Supply234 Questions
Exam 16: Monetary Theory and Policy198 Questions
Exam 17: Macro Policy Debate: Active or Passive198 Questions
Exam 18: International Trade160 Questions
Exam 19: Externalities and the Environment201 Questions
Exam 20: International Finance232 Questions
Exam 21: Economic Development97 Questions
Exam 22: understanding Graphs73 Questions
Exam 23: National Income Accounts20 Questions
Exam 24: The Algebra of Demand-Side Equilibrium72 Questions
Select questions type
If an increase in planned investment of $70 billion causes equilibrium output demanded to rise by $280 billion,the value of the marginal propensity to consume is
(Multiple Choice)
4.8/5  (43)
(43)
Exhibit 9-9 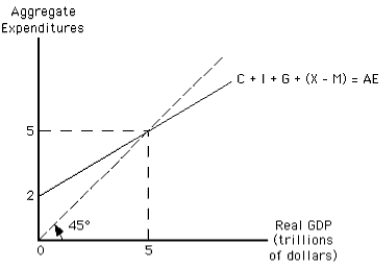 -The smaller the marginal propensity to save,other things constant,
(Multiple Choice)
4.9/5 (31)
If the marginal propensity to save is 1/8,the value of the simple multiplier is
(Multiple Choice)
4.8/5 (33)
We can use an aggregate expenditure line to show how an aggregate demand curve shifts by
(Multiple Choice)
4.8/5 (36)
A decrease in the price level will have which of the following effects?
(Multiple Choice)
4.8/5 (39)
A fall in the price level will shift the aggregate expenditure curve
(Multiple Choice)
4.8/5 (31)
The aggregate demand curve slopes downward to the right,reflecting a relationship between the price level and
(Multiple Choice)
4.8/5 (41)
In the income-expenditure framework,if planned aggregate expenditures are less than real GDP,
(Multiple Choice)
5.0/5 (30)
Exhibit 9-9
-The larger the marginal propensity to save,other things constant,
(Multiple Choice)
4.9/5 (46)
To simplify the aggregate expenditure model,we assume that there is no
(Multiple Choice)
4.7/5 (44)
Consumption plus saving equals disposable income at every level of real GDP demanded.
(True/False)
4.9/5 (34)
Which of the following is illustrated by the distance between the aggregate expenditure line and the 45-degree line at each level of real GDP?
(Multiple Choice)
4.7/5 (41)
Which of the following is true about the relationship between the aggregate demand curve and the aggregate expenditure line?
(Multiple Choice)
4.9/5 (28)
Exhibit 9-10  -According to the graph in Exhibit 9-10,if the price level decreases,the new equilibrium level of real GDP must be
(Multiple Choice)
4.8/5 (30)
Exhibit 9-6
(Trillions of Dollars) Real GDP () Net Taxes (NT) Dispes -able Income (Y-NT) Con- sumption (C) Saving (S) Planned Invest- ment (I) Govern- ment Purchases (G) Net Exports (X-M) Planned Aggregate Expenditures (+++(-) 5.0 1.0 4.0 3.9 0.1 1.0 1.0 -0.7 5.2 5.5 1.0 4.5 4.3 0.2 1.0 1.0 -0.7 5.6 6.0 1.0 5.0 4.7 0.3 1.0 1.0 -0.7 6.0 6.5 1.0 5.5 5.1 0.4 1.0 1.0 -0.7 6.4 7.0 1.0 6.0 5.5 0.5 1.0 1.0 -0.7 6.8
-The marginal propensity to consume (MPC)in Exhibit 9-6 equals
(Multiple Choice)
4.8/5 (34)
Which of the following is assumed constant along the aggregate expenditure line?
(Multiple Choice)
4.9/5 (42)
If households save $40 billion less at each level of income and the MPC = 0.8,the aggregate expenditure line will
(Multiple Choice)
4.7/5 (33)
Filters
- Essay(0)
- Multiple Choice(0)
- Short Answer(0)
- True False(0)
- Matching(0)